Motion Diagram
TLDRThe video script introduces motion diagrams, a visual tool for representing movement over time. It explains using Al's movements as examples, illustrating how dots on a number line represent position at different seconds, with arrows between them indicating velocity. The script contrasts constant velocity with changing velocities, such as acceleration and deceleration, and highlights that while this method is effective for one-dimensional forward motion, it can become complex with changes in direction. This tool is presented as an accessible way to understand and visualize motion in a one-dimensional context.
Takeaways
- 📊 Motion can be represented in various ways, including motion vs. time graphs and motion diagrams.
- 🎥 Motion vs. time graphs provide detailed information but may not be intuitive for beginners.
- 🎬 Movies and animations effectively represent motion but are not easily transferable to textbooks or paper.
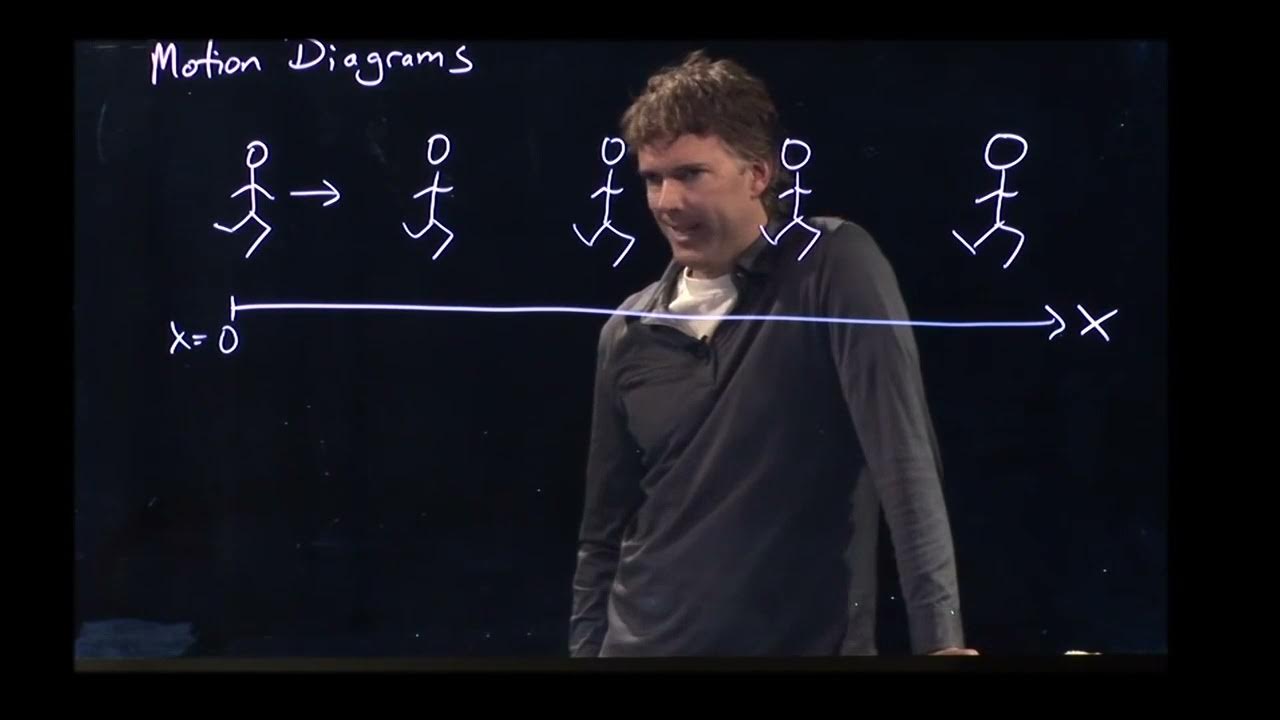
- 👤 Introducing motion diagrams, also known as dot diagrams, as an alternative to represent motion.
- 🏃 Position is represented by a dot, and the dots on a number line indicate distance covered over time.
- 🔜 Arrows connect the dots, representing the change in position from one second to the next and symbolize velocity.
- 📏 Equally spaced dots with arrows of equal length indicate constant velocity.
- 🏃♂️ Faster motion is depicted by dots spaced further apart, with longer arrows representing higher velocity.
- 🏃♂️ Slower motion is shown by dots closer together, with shorter arrows indicating lower velocity.
- 🔄 Changing velocities are represented by varying spacing between dots and the length of arrows over time.
- 🔄 Decreasing velocity is shown by progressively shorter spacings between dots, indicating a slowdown.
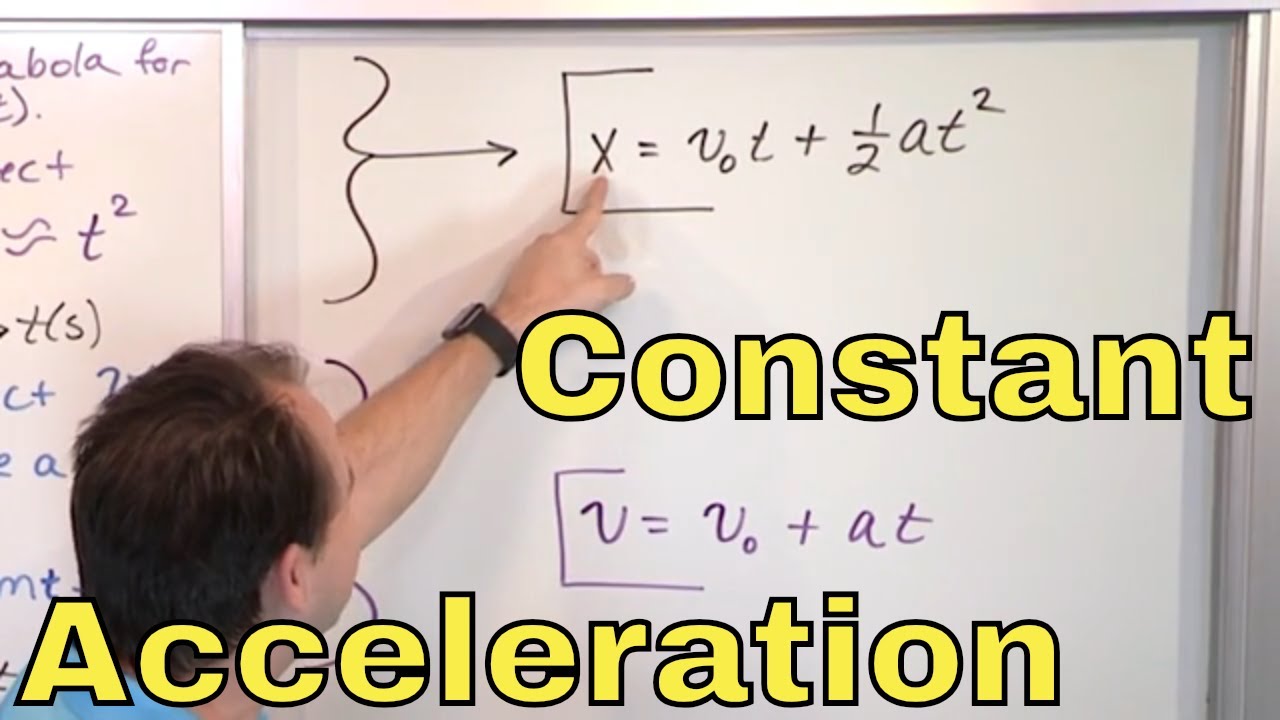
- 🔄 Increasing velocity is shown by dots starting close together and ending much further apart, indicating acceleration.
- 🔢 Motion diagrams are particularly useful for one-dimensional motion in a single direction.
Q & A
What are some ways to represent motion?
-Ways to represent motion include motion versus time graphs, movies and animations, and motion diagrams or dot diagrams.
Why might motion versus time graphs not always make sense to students?
-Motion versus time graphs might not make sense to students when they are first starting because they can be abstract and harder to visualize without a concrete example.
How is Al's position represented in a motion diagram?
-Al's position is represented with a DOT in the motion diagram, indicating his location at each second.
What do the dots in a motion diagram signify?
-The dots in a motion diagram signify the position of an object at different points in time.
How are the arrows in a motion diagram used?
-Arrows in a motion diagram connect the dots and represent how the object moved from one second to the next, indicating velocity, displacement, and direction.
What does the spacing between the dots in a motion diagram indicate?
-The spacing between the dots indicates the velocity of the object. Equal spacing represents constant velocity, while varying spacing indicates changing velocity.
How can you compare velocities using motion diagrams?
-You can compare velocities by looking at the spacing between the dots. Greater spacing indicates higher velocity, as more distance is covered in the same amount of time.
How does a motion diagram represent changing velocity?
-Changing velocity is represented by a progression from larger to smaller spacings (slowing down) or from smaller to larger spacings (speeding up), showing how the velocity varies over time.
What happens if you need to represent motion in multiple dimensions or reverse direction in a motion diagram?
-If representing motion in multiple dimensions or reverse direction, using only dots would not be sufficient; you would need to use arrows to indicate the direction of motion, which could lead to overlapping and confusion.
Why are motion diagrams useful for understanding motion in one dimension?
-Motion diagrams are useful for understanding motion in one dimension because they provide a quick visual representation of an object's position, velocity, and changes in velocity over time.
What is the main advantage of using motion diagrams over other methods of representing motion?
-The main advantage of motion diagrams is their simplicity and ease of use for quickly visualizing and understanding motion, especially when dealing with constant velocity or forward motion in one dimension.
Outlines
🏃 Introducing Motion Diagrams
This paragraph introduces the concept of motion diagrams as an alternative to motion versus time graphs for representing motion. It discusses the challenges students face with graphs and animations, and presents motion diagrams as a more tangible representation. The paragraph explains how position is represented by a dot on a number line, and how the dots connected by arrows can illustrate velocity and displacement over time. It also touches on the representation of constant velocity with equally spaced dots and arrows, and how varying velocities can be depicted by changing the spacing between the dots and the length of the arrows.
Mindmap
Keywords
💡Motion
💡Diagrams
💡Motion versus time graphs
💡Dot diagrams
💡Velocity
💡Displacement
💡Constant velocity
💡Changing velocities
💡Acceleration
💡One-dimensional motion
💡Understanding Motion
Highlights
Introducing motion diagrams as an alternative to Motion vs. Time graphs for better student comprehension.
Using movies and animations to represent motion, though challenging to translate into textbooks or paper.
Representing position with a dot on a number line for simplicity in motion diagrams.
Each dot on the diagram represents Al's position at one-second intervals.
Connecting the dots with arrows to represent the motion, velocity, displacement, and time.
Equally spaced dots indicate constant velocity, with arrows of equal length.
Comparing velocities by observing the spacing of dots, with wider spacing for walking and further apart for running.
Higher velocities are represented by dots spaced further apart and longer arrows.
Lower velocities are shown by dots that are closer together and shorter arrows.
Exploring changing velocities with Al slowing down, represented by progressively shorter spacings of dots.
Examining acceleration through Al speeding up, with dots starting close together and ending much further apart.
Motion diagrams' effectiveness in one-dimensional forward motion, simplifying the understanding of velocities.
The challenge of using motion diagrams for multidirectional or reverse motion, due to potential overlap and confusion.
Motion diagrams as a practical tool for understanding one-dimensional motion and analyzing velocities.
Transcripts


5.0 / 5 (0 votes)
Thanks for rating: