Why Dividing By N Underestimates the Variance
TLDRIn this Stat Quest episode, host Josh Stormer explains why using the sample mean and dividing by 'n' (the number of measurements) underestimates the population variance. Through examples and mathematical proofs, he demonstrates that the minimum variance occurs around the sample mean, which is less than the variance around the population mean. To accurately estimate the population variance, one should divide by 'n minus 1'. This insightful video educates viewers on the importance of this statistical adjustment for a more precise estimation of population parameters.
Takeaways
- 📊 Understanding population parameters is crucial for statistical analysis, and estimating these parameters often involves using sample data.
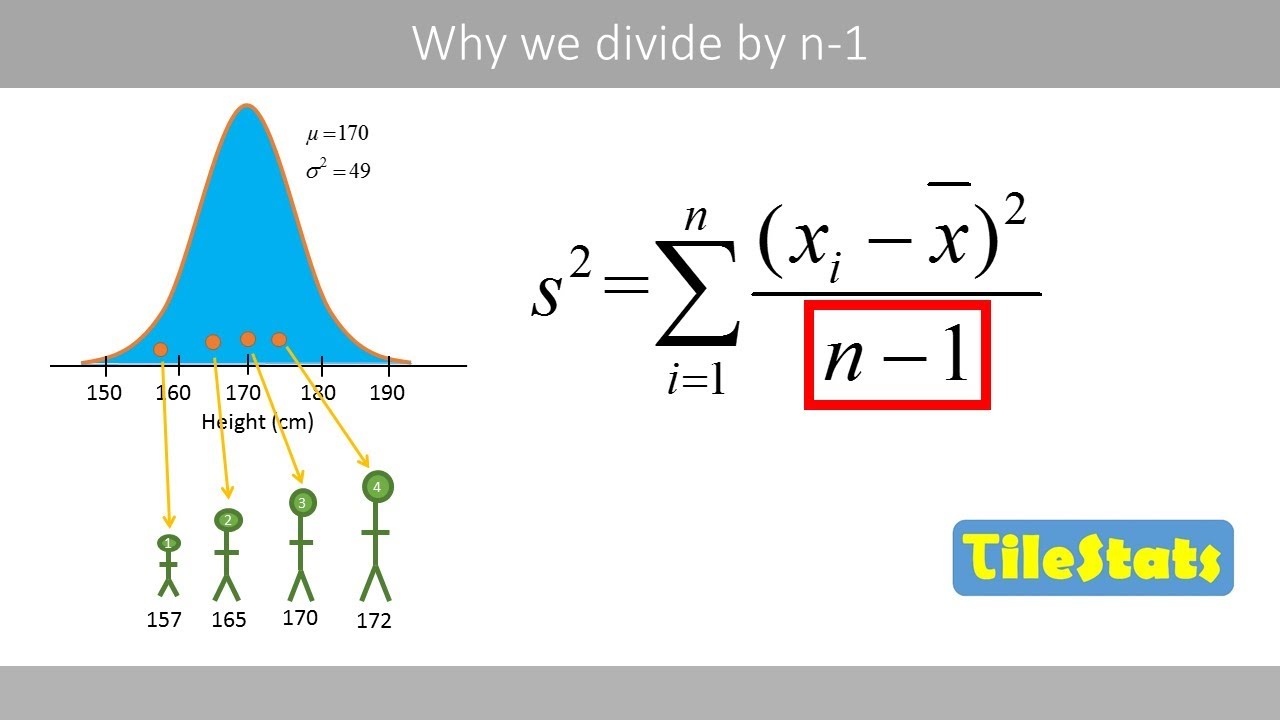
- 🧠 The population mean (μ) is calculated by dividing the sum of all measurements by the number of measurements, which equals the average measurement.
- 📈 The population variance is the average of squared distances between data points and the population mean, with the standard deviation being its square root.
- 🔄 When estimating population parameters from a sample, we use the sample mean (x̄) and divide by n (number of measurements) for the estimated population mean.
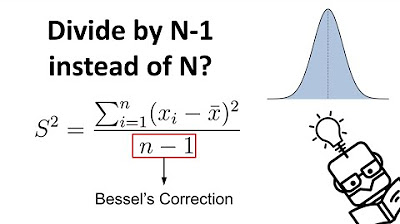
- 🌐 The estimated population variance is calculated by dividing the sum of squared differences by n minus 1, which compensates for the bias introduced by using the sample mean.
- 🔢 Dividing by n minus 1 instead of n corrects the underestimation of variance because the differences around the sample mean are typically smaller than those around the population mean.
- 📉 Using the sample mean and dividing by n consistently underestimates the variance around the population mean, as it does not account for the sample's specific distribution.
- 🥂 The concept of bias is important in statistics; the bias here is that using the sample mean leads to a smaller variance estimate than what would be observed around the true population mean.
- 📊 The minimum variance around the sample mean (x̄) is less than that around the population mean (μ), which is why dividing by n minus 1 is necessary for accurate variance estimation.
- 🔍 The use of calculus, specifically taking the derivative of the variance formula, helps identify the point at which variance is minimized, which corresponds to the sample mean.
- 🤔 The script emphasizes the importance of using squared differences rather than absolute values when calculating variance, as it allows for easier mathematical manipulation and understanding of the data distribution.
Q & A
What is the main topic of discussion in the Stat Quest video?
-The main topic of discussion in the Stat Quest video is why dividing by n underestimates the population variance when estimating population parameters from sample data.
What is the population mean and how is it calculated?
-The population mean, denoted by mu, is the average value of a测量 entire population. It is calculated by dividing the sum of all measurements by the number of measurements.
How is the population variance related to the population standard deviation?
-The population variance is the average of the squared distances between the data and the population mean. The population standard deviation is the square root of the population variance.
What is the difference between the estimated population mean and the population mean?
-The estimated population mean, denoted by x-bar, is the average of the sample measurements, while the population mean, denoted by mu, is the average of the entire population's measurements.
Why do we divide by n minus 1 instead of n when estimating the population variance?
-Dividing by n minus 1 compensates for the fact that we are calculating differences from the sample mean instead of the population mean. This adjustment prevents the consistent underestimation of the variance around the population mean.
How does the sample mean affect the calculation of variance?
-Using the sample mean in the calculation of variance leads to an underestimation of the variance around the population mean because the differences between the data and the sample mean tend to be smaller than the differences between the data and the population mean.
What is the purpose of squaring the differences in the variance calculation?
-Squaring the differences eliminates the effect of the sign (positive or negative) and focuses on the magnitude of the deviation from the mean, which is necessary for the calculus involved in finding the minimum variance.
How does the Stat Quest video demonstrate the concept of underestimation of variance?
-The video uses simple examples and mathematical proofs to show that dividing by n instead of n minus 1 results in a smaller variance around the sample mean compared to the population mean, thus demonstrating the underestimation of variance.
What happens when we take the derivative of the variance formula with respect to V?
-Taking the derivative of the variance formula with respect to V helps determine the slope of the curve at different values for V. Setting the derivative to zero allows us to find the value of V (which is the sample mean) that minimizes the variance.
What is the significance of the minimum variance point in the context of the video?
-The minimum variance point is significant because it represents the value around which the variance is least. The video shows that this point corresponds to the sample mean, not the population mean, highlighting the underestimation issue.
How does the Stat Quest video conclude the discussion on underestimation of variance?
-The video concludes that when estimating the population variance, dividing by n instead of n minus 1 results in an underestimation of the variance around the population mean. It emphasizes that this is a consistent pattern that does not depend on the size of the sample.
Outlines
📊 Introduction to Variance Underestimation
This paragraph introduces the topic of variance underestimation in statistical analysis. The host, Josh Stormer, welcomes viewers to the show and sets the stage for a discussion on why using 'n' (the number of measurements) in the calculation of population variance can lead to an underestimation of the true variance. It references previous episodes on estimating mean, variance, and standard deviation, and emphasizes the importance of understanding these concepts. The segment ends with a promise to provide more details on why 'n' leads to an underestimation in a future episode.
🧠 Explanation of Variance Underestimation
In this paragraph, the video script delves into the reasons behind the underestimation of population variance when using 'n' in calculations. It starts with simple examples to illustrate the concept, showing that using the sample mean results in a smaller variance than when using the population mean. The explanation continues with a more mathematical approach, using calculus to derive the formula for variance and finding the minimum variance point. The paragraph emphasizes that the minimum variance occurs at the sample mean, not the population mean, leading to an underestimation when 'n' is used in the calculation.
🔢 Mathematical Proof of Variance Underestimation
This paragraph presents a mathematical proof to validate the claim that dividing by 'n' results in an underestimation of the population variance. It begins with a practical example using specific data points and then generalizes the proof for any set of five measurements. The explanation involves taking the derivative of the variance formula with respect to an unknown value 'V' and finding where this derivative equals zero, which indicates the minimum variance. The proof shows that regardless of the sample size, the minimum variance is achieved when 'V' equals the sample mean (x-bar), reinforcing the idea that dividing by 'n' leads to an underestimation of the true population variance.
🤔 Rationale Behind Squaring Differences
The final paragraph addresses the rationale for squaring differences in variance calculations rather than using absolute values. It explains that squaring differences allows for a more straightforward mathematical analysis, particularly when finding the minimum variance using calculus. The paragraph contrasts this with the use of absolute values, which would result in a graph with sharp angles at the minimum value, making the calculus more complex and the minimum value harder to determine. The summary highlights the importance of understanding the correct method for estimating population variance and ends with a reminder that dividing by 'n-1', rather than 'n', is the appropriate way to estimate population variance.
Mindmap
Keywords
💡Stack Quest
💡Population Parameters
💡Estimation
💡Variance
💡Standard Deviation
💡Sample Mean (x-bar)
💡Bessel's Correction
💡Histogram
💡Normal Curve
💡Squared Differences
💡Derivative
Highlights
The importance of estimating population parameters is discussed, emphasizing the reason behind wanting to estimate population parameters.
An overview of estimating the mean, variance, and standard deviation is provided, with a reference to a previous quest for more information.
The concept of population mean and variance is introduced, explaining how they are calculated using the sum of measurements and the number of measurements.
The difference between population standard deviation and estimated population standard deviation is highlighted, noting the use of n minus 1 in estimation.
The reason for dividing by n minus 1 is explained, which compensates for calculating differences from the sample mean instead of the population mean.
The assertion that using the sample mean underestimates the variance around the population mean is supported with examples and a future quest promise.
Simple examples are used to illustrate how dividing by n leads to an underestimation of the population variance compared to using the sample mean.
A mathematical approach is introduced to understand why dividing by n underestimates the population variance, with a promise of a comprehensive proof.
The use of derivatives to find the minimum variance is explained, linking it to the slope of the curve at different values for V.
Three different methods to find the minimum variance are presented, covering observed data, any five measurements, and any sample size.
The conclusion that the minimum variance is always around the sample mean (x-bar) is drawn, regardless of the sample size.
The rationale behind squaring the differences instead of using absolute values is discussed, relating to the ease of calculus and understanding minimum values.
The summary restates the key point that dividing by n underestimates the variation in data around the population mean, and the solution is to divide by n minus one.
The practical application of this statistical concept is emphasized, noting its importance in accurately estimating population parameters.
The quest concludes with a call to action for viewers to subscribe and support the content for more educational statistical explorations.
Transcripts
Browse More Related Video
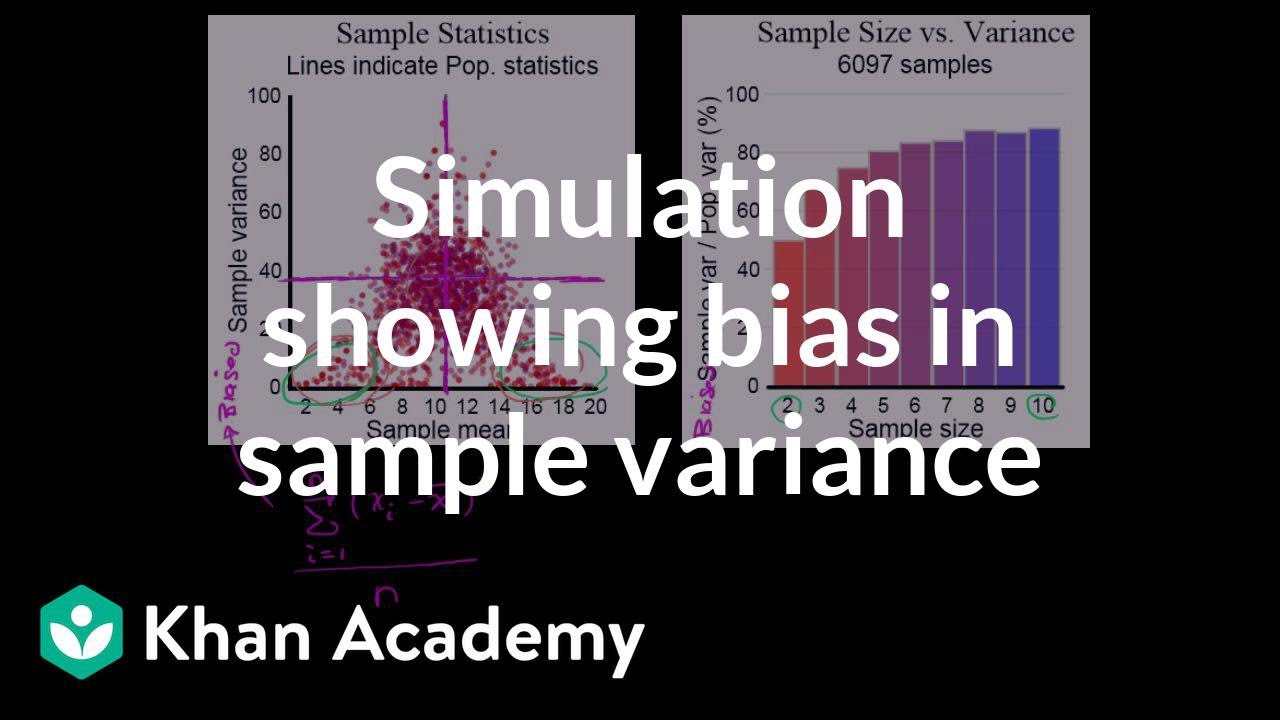
Simulation showing bias in sample variance | Probability and Statistics | Khan Academy
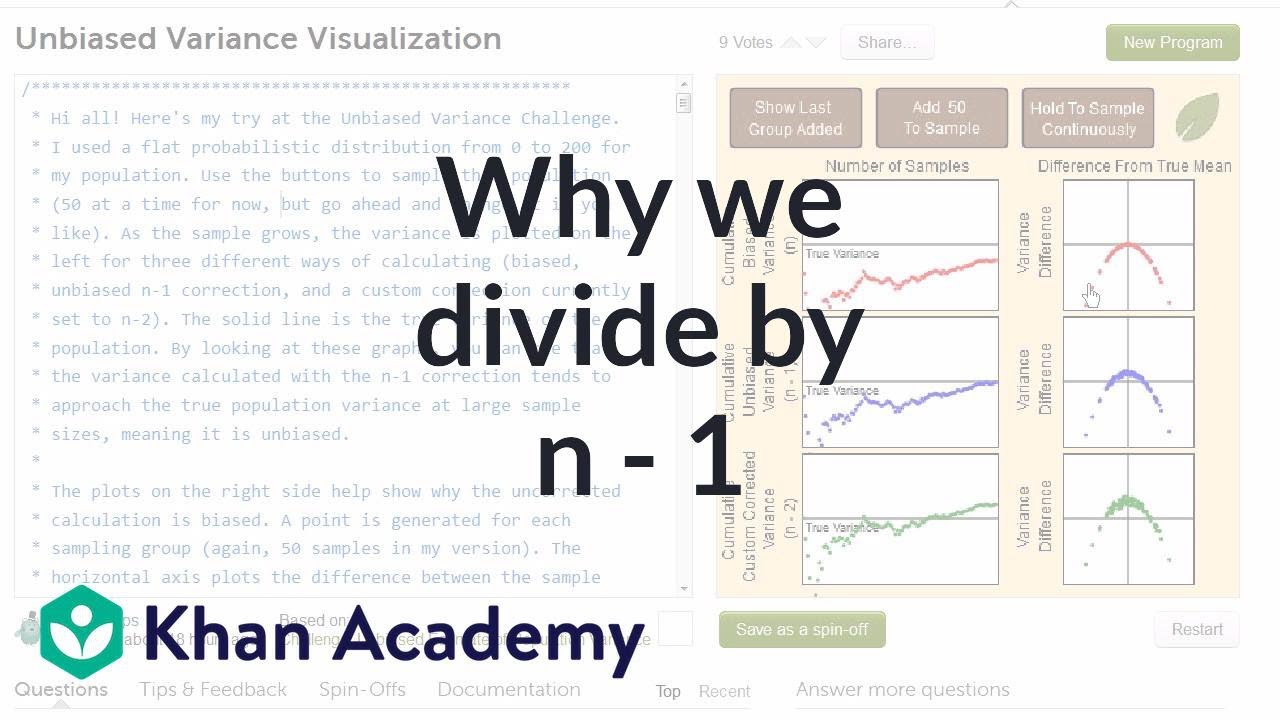
Another simulation giving evidence that (n-1) gives us an unbiased estimate of variance
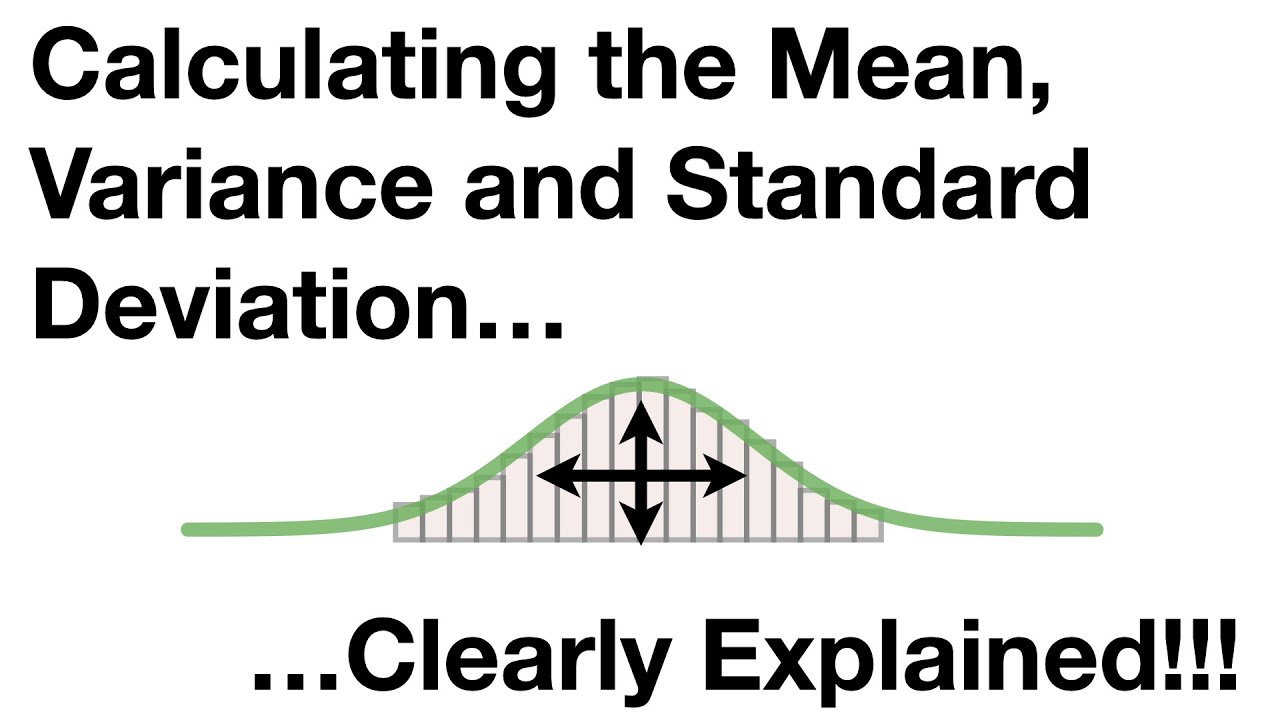
Calculating the Mean, Variance and Standard Deviation, Clearly Explained!!!
Sample variance | Descriptive statistics | Probability and Statistics | Khan Academy
Why We Divide by N-1 in the Sample Variance (Standard Deviation) Formula | The Bessel's Correction
Why do we divide by n-1 and not n? | shown with a simple example | variance and sd
5.0 / 5 (0 votes)
Thanks for rating: