Statistics 101: Confidence Interval Estimation, Sigma Known
TLDRThis video delves into the concept of confidence intervals in statistics, emphasizing their importance in inferential statistics. It explains how confidence intervals help estimate population parameters based on sample data, highlighting the difference between known and unknown population standard deviations. The video uses relatable examples, such as the gumball guessing game, to illustrate the concept effectively. It also clarifies common misconceptions about confidence intervals, stressing that they represent the probability of the sample mean falling within a certain range of the population mean, not the other way around.
Takeaways
- 📚 Stay positive and keep trying when struggling with statistics, as perseverance leads to success.
- 🎯 The main goal of the video is to explain the concept of confidence intervals in statistics.
- 🔢 Confidence intervals allow us to estimate population parameters with a known level of confidence.
- 📈 Two types of confidence intervals: when the population standard deviation is known (Z-score) and when it is unknown (T-score).
- 📊 The standard error of the mean is crucial in forming confidence intervals and is calculated by dividing the population standard deviation by the square root of the sample size.
- 📐 The larger the sample size, the smaller the standard error and the more accurate the confidence interval.
- 🎲 The video uses a gumball guessing game analogy to illustrate the concept of confidence intervals.
- 🏦 A real-world example of a bank vice president estimating average checking account balances demonstrates the application of confidence intervals.
- 📉 The sampling distribution of the mean is a distribution of all possible sample means from a given population.
- 🔍 The confidence interval is not the probability that the population mean lies within the sample interval, but rather the probability that the sample mean falls within a certain distance of the population mean.
- 🚫 Common mistake: Misinterpreting confidence intervals as the probability of the population mean being within the interval, when it actually reflects the proportion of sample means expected to fall within the interval.
Q & A
What is the main topic of the video?
-The main topic of the video is confidence intervals in inferential statistics, specifically when the population standard deviation is known.
What is the purpose of a confidence interval?
-The purpose of a confidence interval is to quantify the uncertainty associated with estimating a population parameter from a sample statistic.
How does the gumball guessing game relate to confidence intervals?
-The gumball guessing game illustrates the concept of confidence intervals by showing how the width of the interval (plus or minus a certain number) affects the accuracy of the estimate and the reward given for guessing within that interval.
What are the two types of confidence intervals discussed in the video?
-The two types of confidence intervals discussed are those where the population standard deviation is known (Sigma known) and those where the population standard deviation is not known and must be estimated.
What is the significance of the 95% confidence interval in statistics?
-The 95% confidence interval is significant because it represents a commonly used level of confidence that indicates there is a 95% probability that the interval contains the true population parameter based on repeated sampling.
How does the sample size affect the standard error of the mean?
-The sample size affects the standard error of the mean by reducing it as the sample size increases, given a constant population standard deviation. A larger sample size leads to a more precise estimate of the population parameter.
What is the relationship between the standard error of the mean and the margin of error?
-The margin of error is calculated by multiplying the standard error of the mean by a critical value (such as 1.96 for a 95% confidence interval). This margin of error is then used to construct the confidence interval.
What is the correct interpretation of a 95% confidence interval?
-A 95% confidence interval means that if we were to take many samples and construct a 95% confidence interval for each, approximately 95% of those intervals would contain the true population parameter.
Why is it a common mistake to say that there is a 95% probability that the population mean lies within the sample interval?
-This statement is incorrect because it implies that the population mean itself has randomness, which it does not. The confidence interval reflects the precision of the sample mean as an estimate of the population mean, not the probability of the population mean falling within the interval.
How does the video encourage viewers who may be struggling with their statistics class?
-The video encourages struggling viewers to stay positive, recognize their accomplishments so far, and understand that temporary setbacks are part of the learning process. It emphasizes the importance of hard work, practice, and patience, and assures viewers that they have the potential to succeed with the right approach.
What is the role of the standard normal curve in calculating confidence intervals?
-The standard normal curve, or Z curve, is used when the population standard deviation is known to assign Z scores to the upper and lower boundaries of the confidence interval. This allows for the calculation of the margin of error based on the desired level of confidence.
Outlines
📚 Introduction to Statistics and Confidence
The paragraph introduces the video series on basic statistics, emphasizing the importance of maintaining a positive attitude when facing challenges in learning statistics. It encourages viewers to follow the creator on various platforms for updates and engagement. The video aims to help beginners understand fundamental concepts of statistics, including inferential statistics and confidence intervals, with a promise of detailed explanations.
🎯 Understanding Confidence Intervals
This paragraph explains the concept of confidence intervals, using a simple gumball guessing game as an analogy. It illustrates how confidence intervals work by estimating a value within a certain range, and how the level of confidence is tied to the range of the estimate. The paragraph transitions into a real-world example of a bank vice president estimating average checking account balances, highlighting the need to decide on an acceptable confidence level.
📈 Dealing with Population Standard Deviation
The paragraph delves into the two scenarios of estimating population parameters: when the population standard deviation is known and when it is not. It explains that for the former, a Z-score can be used, while for the latter, a T-score is required. The paragraph also reviews the concept of the standard error of the mean and its role in forming confidence intervals, emphasizing the impact of sample size on the standard error.
📊 Sampling Distribution and Confidence
This section discusses the sampling distribution of the mean, explaining how it is derived from multiple sample means taken from a population. It clarifies that the area under the curve of the distribution represents the entire probability, which is always one. The paragraph introduces the concept of splitting the curve into a 95% interval and the associated alpha regions, which represent the uncertainty or margin of error in the estimate.
🔢 Standard Error and Sample Size
The paragraph explains the relationship between the standard error of the mean and the sample size. It highlights that a larger sample size reduces the standard error, leading to a narrower distribution and less variation. The concept is illustrated by showing how the standard error affects the width of the confidence interval, with a smaller sample size resulting in a wider interval and more variation.
📋 Interpreting Confidence Intervals
This paragraph focuses on the correct interpretation of confidence intervals. It clarifies that the randomness lies in the sample selection, not in the population mean. The paragraph emphasizes that a confidence interval does not represent the probability that the population mean lies within the interval, but rather the probability that the sample mean will be within a certain distance of the population mean. It warns against common misconceptions and reiterates the importance of proper interpretation.
🧮 Calculating Margin of Error
The paragraph provides a practical example of calculating the margin of error for a given confidence level and sample mean. It explains the process of finding the standard error and then using it to determine the margin of error for a 95% confidence interval. The example involves estimating the mean amount spent per customer at a restaurant chain, with a given population standard deviation and sample size.
🏢 Application in Business: Customer Service Time
This section applies the concept of confidence intervals to a business scenario involving customer service time in brick-and-mortar stores. It discusses the issue of 'showrooming' and how management can use confidence intervals to determine if it is a significant problem. The example involves calculating a 95% confidence interval for the time sales associates spend with false customers, based on a sample of associates and an assumed population standard deviation.
🎓 Final Thoughts on Confidence Intervals
The paragraph concludes the discussion on confidence intervals by reiterating their importance in inferential statistics and their role in quantifying the accuracy of estimates about population parameters. It emphasizes the need for careful interpretation and understanding of the concepts discussed. The video ends with words of encouragement for viewers who may be struggling with their studies, reminding them of their potential and the value of continuous learning.
Mindmap
Keywords
💡Statistics
💡Inferential Statistics
💡Population Parameters
💡Sample Statistics
💡Confidence Intervals
💡Standard Error of the Mean
💡Margin of Error
💡Randomness
💡Estimation
💡Probability
Highlights
The video series aims to help individuals who are new to statistics by explaining basic concepts in a detailed, slow, and deliberate manner.
Confidence intervals are introduced as a method to quantify the confidence in estimates about a population parameter based on sample data.
There are two types of confidence intervals: one where the population standard deviation is known and another where it is unknown.
The video uses the gumball guessing game as an analogy to explain the concept of confidence intervals, emphasizing the idea of quantifying accuracy.
The importance of sample size in determining the standard error of the mean and its impact on the confidence interval is discussed.
The video explains that the standard error of the mean is crucial in forming confidence intervals and is related to the margin of error.
The concept of the sampling distribution of the mean is introduced, which is the distribution of all sample means from the same population.
The video clarifies that the population mean is fixed and the randomness lies in the elements chosen for the sample, which affects the representativeness of the sample.
The proper interpretation of confidence intervals is emphasized, noting that it is not the probability that the population mean lies within the sample interval.
The video provides a real-world example of estimating the average checking account balance to illustrate the application of confidence intervals in business.
The process of calculating the margin of error for a confidence interval is demonstrated using a given population standard deviation and sample size.
A detailed example is worked out, showing how to calculate a 95% confidence interval for the mean amount spent per customer at a restaurant chain.
The impact of sample size on the width of the confidence interval is discussed, with smaller sample sizes leading to wider intervals and more variation.
The video concludes with an encouragement for viewers to stay positive and keep learning, emphasizing that perseverance leads to improvement.
The concept of confidence intervals is highlighted as an essential tool in inferential statistics for quantifying the accuracy of estimates.
The video stresses the importance of understanding the difference between the sample mean and the population mean when interpreting confidence intervals.
A common misconception about confidence intervals is addressed, clarifying that it is the sample mean within a certain distance of the population mean, not the other way around.
Transcripts
Browse More Related Video
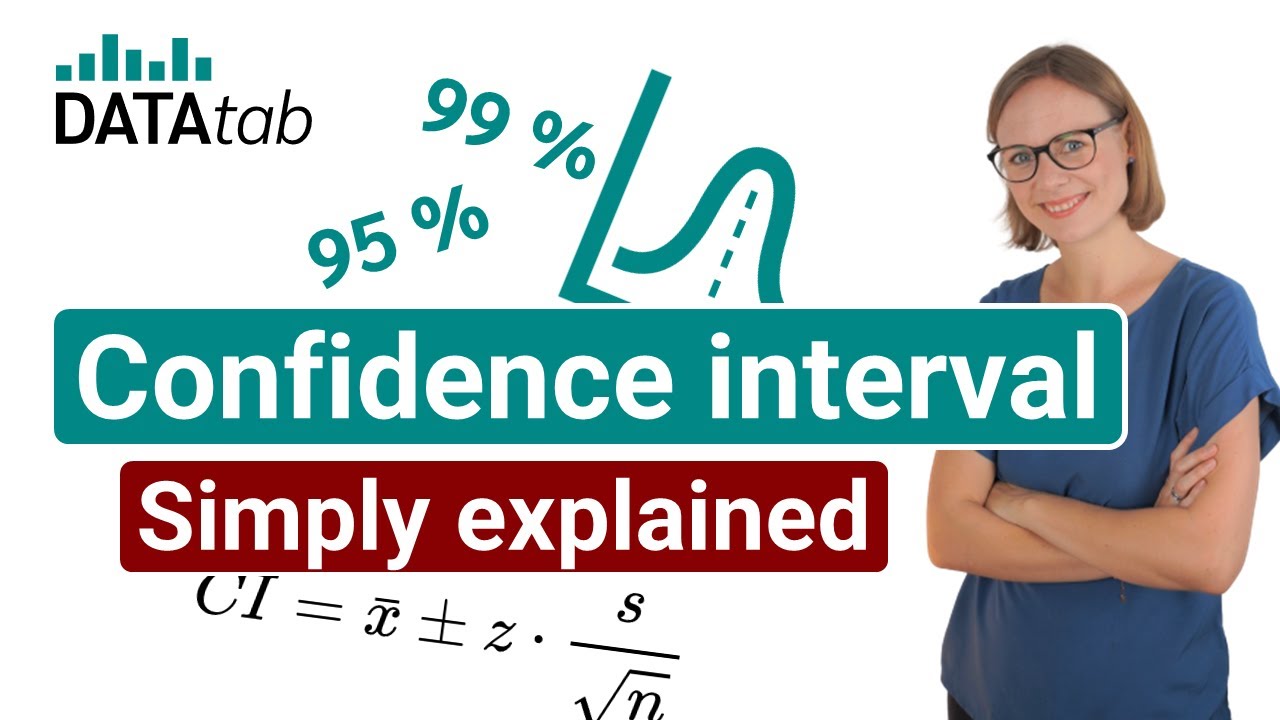
Confidence Interval [Simply explained]
Confidence Interval Concept Explained | Statistics Tutorial #7 | MarinStatsLectures

8. Sampling and Standard Error
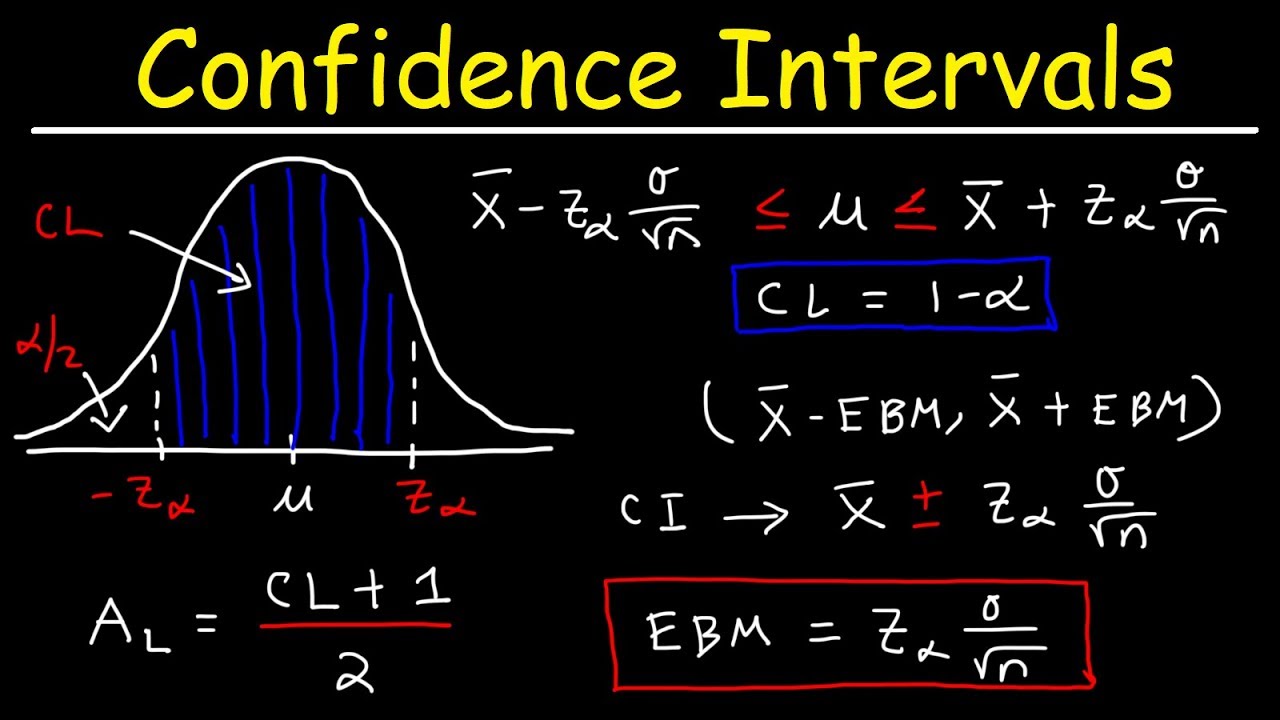
How To Find The Z Score, Confidence Interval, and Margin of Error for a Population Mean
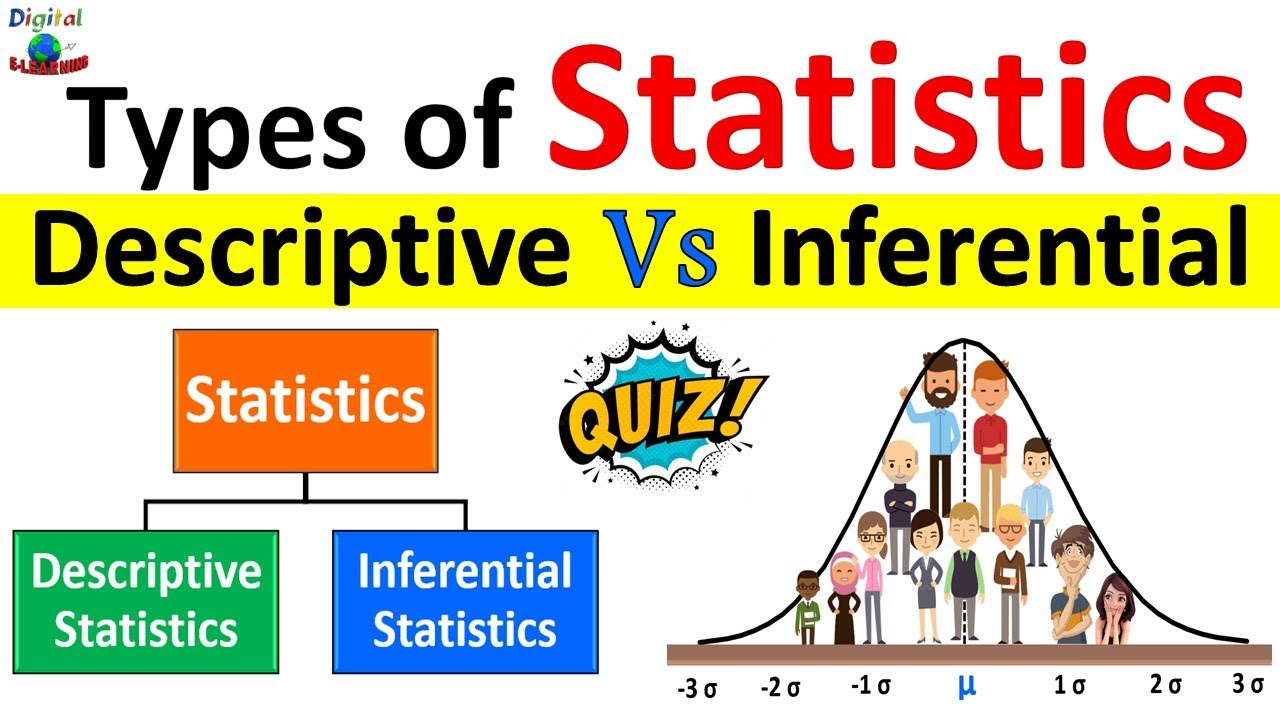
Descriptive Statistics vs Inferential Statistics | Measure of Central Tendency | Types of Statistics

Standard Error (of the sample mean) | Sampling | Confidence Intervals | Proportions
5.0 / 5 (0 votes)
Thanks for rating: