8. Sampling and Standard Error
TLDRThis MIT OpenCourseWare lecture delves into the concept of sampling in statistics, emphasizing the importance of inferential statistics through random sampling. It explains the difference between simple random sampling and stratified sampling, illustrating how political polls and Monte Carlo simulations use sampling to estimate population parameters. The lecture uses temperature data to demonstrate how sample means approximate the population mean, highlighting the central limit theorem's role in normalizing sample means and the significance of the standard error in creating confidence intervals for more precise estimates.
Takeaways
- 📚 The lecture introduces the concept of sampling in statistics, emphasizing its importance in inferential statistics for making inferences about populations.
- 🔍 It explains the use of Monte Carlo simulations for estimating values like pi, highlighting how random samples can lead to confidence intervals through the empirical rule.
- 🌐 The professor discusses the difference between sampling in simulations versus real-world scenarios, such as political polls, which rely on a single sample to estimate confidence intervals.
- 🔄 The lecture differentiates between 'simple random sampling' and 'stratified sampling', noting that the latter is often used in polls to ensure representation of subgroups.
- 🤓 An example of temperature data from various U.S. cities is used to illustrate the process of sampling and the computation of statistics like mean and standard deviation.
- 📈 The script covers the use of visualization tools like histograms to understand data distribution and the application of numpy functions for data analysis.
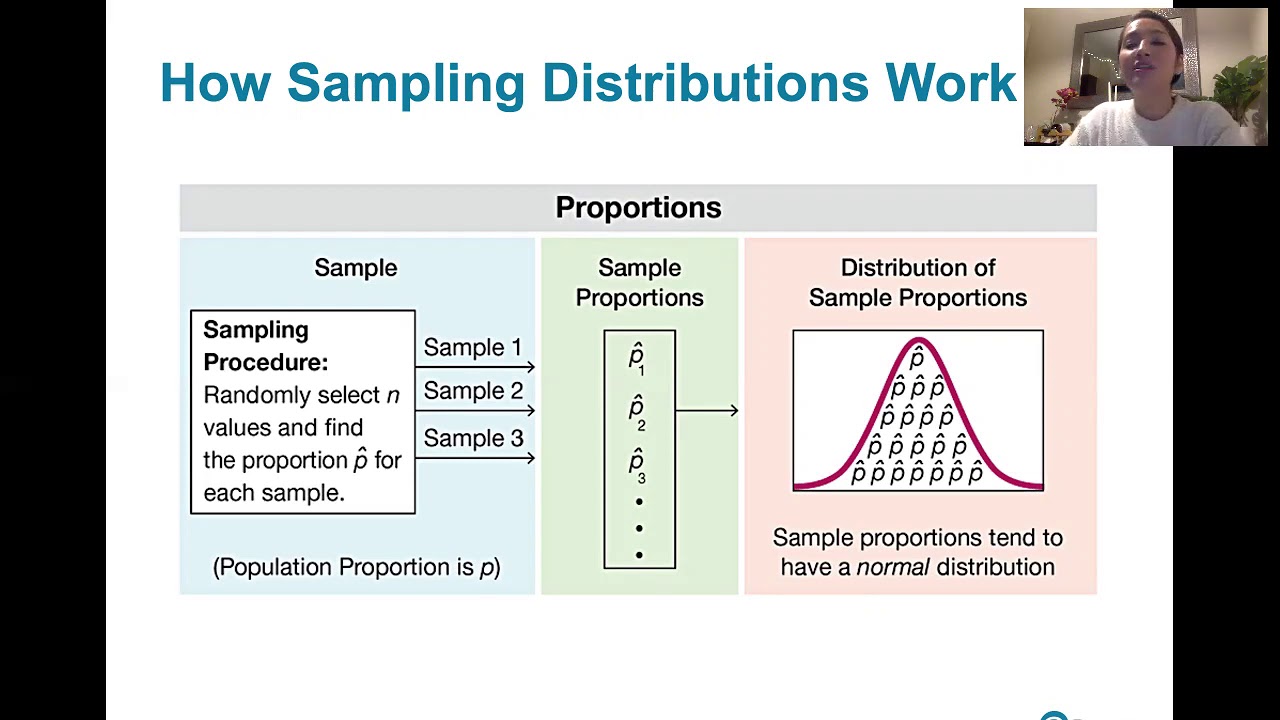
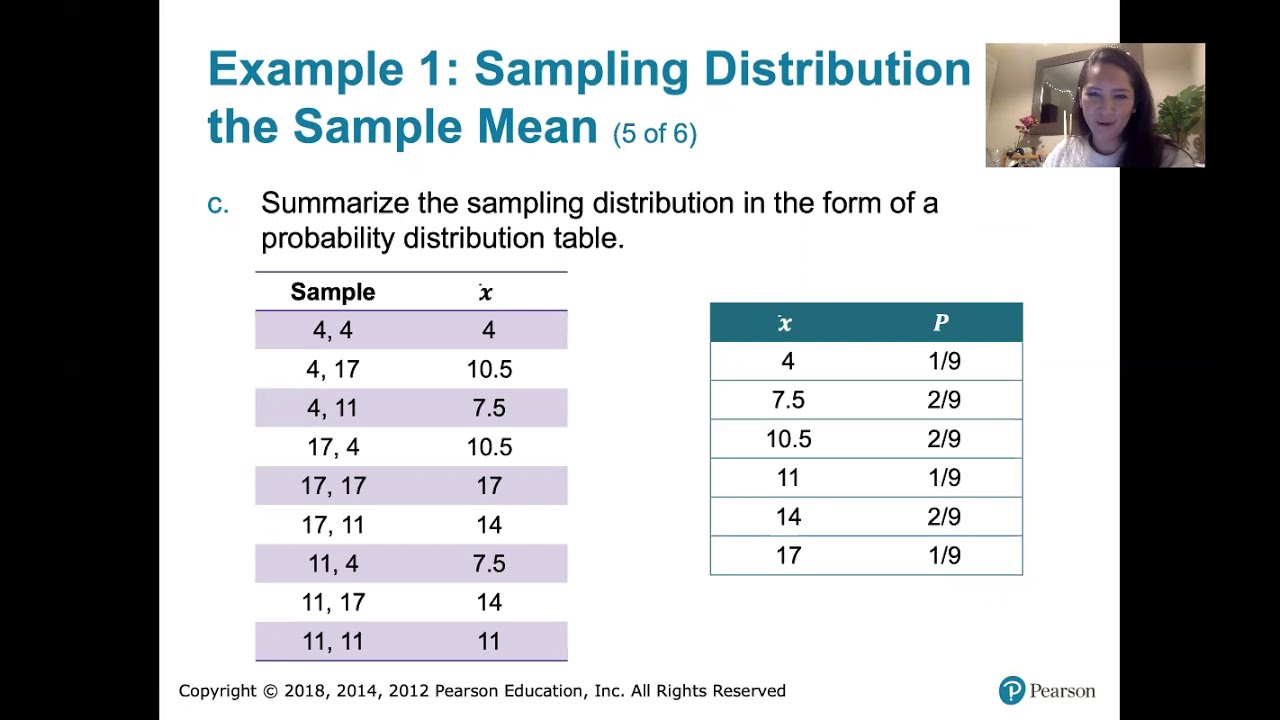
- 📊 The central limit theorem is discussed, showing how the distribution of sample means approximates a normal distribution regardless of the population distribution.
- 📉 The concept of 'standard error' is introduced, explaining its role in estimating the variability of the sample mean and its relation to the population standard deviation.
- 🔢 The importance of sample size is underscored, with larger samples leading to a reduction in standard error and thus narrower confidence intervals.
- 📉 Error bars are presented as a method to visualize data variability and confidence intervals on graphs, aiding in the comparison of different groups or conditions.
- 🔧 The script concludes with an experiment to test the effectiveness of sample sizes in estimating population parameters, revealing that a sample size of 200 provides a good approximation for the given temperature data.
Q & A
What is the main topic of Lecture 8?
-The main topic of Lecture 8 is sampling, focusing on how to make inferences about populations through random samples and the concepts of inferential statistics.
What is Monte Carlo simulation and how was it used in the context of finding the value of pi?
-Monte Carlo simulation is a method that uses random sampling to compute results. In the context of finding the value of pi, it was used to generate lots of random samples to compute confidence intervals, relying on the empirical rule to estimate the likelihood of the results.
What is the difference between sampling in a simulation and sampling in a real-world experiment?
-In a simulation, you can run multiple instances to generate random samples and compute confidence intervals. In a real-world experiment, you often have to rely on a single sample due to practical constraints, such as conducting a political poll with a sample of people.
What is probability sampling and why is it important?
-Probability sampling is a method where each member of the population has a non-zero probability of being included in the sample. It is important to ensure that the sampling process is unbiased and representative of the entire population.
What are the two main types of probability sampling mentioned in the lecture?
-The two main types of probability sampling mentioned are simple random sampling, where each member of the population has an equal chance of being chosen, and stratified sampling, where the population is divided into subgroups and samples are taken from each subgroup proportional to their size.
Why might simple random sampling not be appropriate in certain situations?
-Simple random sampling might not be appropriate when the population is not evenly distributed across different subgroups. For example, if you want to survey a diverse group like MIT students and randomly sample could end up with a majority from engineering and science, which might not represent the entire student body accurately.
What is stratified sampling and when is it used?
-Stratified sampling is a method where the population is divided into subgroups, and a simple random sample is taken from each subgroup proportional to the size of the subgroups. It is used when there are small subgroups that need to be represented in the sample to ensure accurate representation of the population.
How does the central limit theorem relate to sampling and confidence intervals?
-The central limit theorem states that the distribution of the means of a sufficiently large number of samples from a population will be approximately normal, regardless of the shape of the population distribution. This allows us to use the empirical rule to estimate confidence intervals for the sample means.
What is the standard error of the mean and how is it calculated?
-The standard error of the mean is a measure of the standard deviation of the sample means. It is calculated as the population standard deviation (sigma) divided by the square root of the sample size (n). It provides an estimate of the variability of the sample means around the population mean.
How does increasing the sample size affect the standard deviation and the confidence interval of the sample mean?
-Increasing the sample size reduces the standard deviation of the sample means, which in turn results in a narrower confidence interval for the sample mean. This means that larger samples provide more precise estimates of the population mean.
What is the relationship between the sample size and the need for samples in sampling a population?
-The need for samples does not increase with the size of the population. Even with a larger population, a relatively small sample size can be sufficient to estimate population parameters accurately, as long as the samples are chosen randomly and the sample size accounts for the skewness of the population distribution.
Why might political polls only sample a small number of people and still claim to be representative?
-Political polls can be representative with a small sample size because the central limit theorem suggests that the sample mean will be approximately normally distributed around the population mean, especially as the sample size increases. This allows for accurate estimation of population parameters even with a limited number of samples.
What is the significance of the standard error in estimating the population mean from a single sample?
-The standard error is significant because it provides an estimate of the variability of the sample mean from the population mean. By using the standard error, researchers can create confidence intervals around the sample mean, which gives an estimate of the range within which the population mean is likely to fall.
How can the sample standard deviation be used as an estimate for the population standard deviation?
-The sample standard deviation can be used as an estimate for the population standard deviation, especially when the sample size is large enough. This is because, with a sufficiently large sample, the sample standard deviation provides a good approximation of the variability in the population.
What factors affect the accuracy of using the sample standard deviation as an estimate for the population standard deviation?
-The accuracy of using the sample standard deviation as an estimate for the population standard deviation is affected by the skewness of the population distribution and the sample size. A highly skewed distribution may require a larger sample size to get an accurate estimate, whereas a more uniform distribution may need fewer samples.
Outlines
📚 Introduction to Sampling and Inferential Statistics
The professor begins by discussing the importance of sampling in inferential statistics, emphasizing the use of random samples to make inferences about populations. The lecture introduces the concept of Monte Carlo simulation for estimating the value of pi and highlights the empirical rule for confidence intervals. The discussion then shifts to real-world sampling, such as political polls, and the difference between simulation-based sampling and actual data collection. Probability sampling is introduced, with a focus on simple random sampling to avoid bias.
🔍 Exploring Sampling Techniques: Simple Random Sampling and Stratified Sampling
The lecture delves into the specifics of simple random sampling, where every member of the population has an equal chance of being selected. It contrasts this with stratified sampling, which involves dividing the population into subgroups and sampling proportionally from each. The professor uses the example of surveying MIT students to illustrate the potential pitfalls of random sampling and the benefits of stratified sampling in ensuring representative subgroups.
🌡️ Analyzing Temperature Data: An Example of Sampling in Action
The professor presents a practical example using temperature data from the US Centers for Environmental Information, covering a span of 55 years across 21 American cities. The dataset, comprising 422,000 examples, is used to demonstrate the process of data analysis in data science. The professor introduces numpy.std for standard deviation and random.sample for obtaining simple random samples, and discusses the concepts of sampling with and without replacement.
📊 Visualizing Data Distribution and Understanding Sample Variability
The lecture continues with the visualization of temperature data through histograms and the examination of its distribution. The professor discusses the difference between the population mean and sample mean, and the significance of standard deviation in understanding sample variability. The central limit theorem is introduced to explain the distribution of sample means and its approximation to a normal distribution.
🔍 Deepening the Analysis: Confidence Intervals and Sample Size
The professor explores the concept of confidence intervals, demonstrating how they can be calculated using the standard deviation of sample means. The impact of increasing the number of samples and the size of each sample on the width of the confidence interval is discussed. The central limit theorem is again highlighted as the reason for the sample means' distribution's closeness to a normal distribution.
📈 Error Bars and Visualizing Data Variability
The lecture introduces error bars as a method for visualizing the variability of data and confidence intervals. Using an example of pulse rate versus exercise frequency, the professor explains how error bars can indicate trends and the significance of overlapping confidence intervals. The concept is then applied to the temperature dataset, demonstrating how error bars can provide a visual representation of the data's confidence intervals.
🔬 The Central Limit Theorem and Its Implications for Sampling
The professor revisits the central limit theorem, focusing on its third aspect related to the variance of sample means. The standard error of the mean is introduced, and its formula is explained. The lecture demonstrates how the standard error can be used to estimate the standard deviation of the population, given a single sample, and the importance of sample size in this estimation.
🤔 The Catch of Using Sample Standard Deviation as an Estimator
The lecture addresses the challenge of using the sample standard deviation as an estimator for the population standard deviation, given that the population standard deviation is typically unknown. The professor discusses the surprising accuracy of this approach and explores the relationship between sample size and the accuracy of the sample standard deviation as an estimator.
📊 Distributions and Sample Size: Factors Affecting Estimation Accuracy
The professor investigates how different population distributions and sizes affect the accuracy of using the sample standard deviation as an estimator. Through experiments on uniform, normal, and exponential distributions, the lecture reveals that skewness significantly impacts the sample size needed for accurate estimation, while population size surprisingly does not.
🗳️ Political Polls and the Importance of Sample Size in Representation
The lecture concludes with a discussion on the practical application of sampling in political polls, emphasizing the importance of choosing an appropriate sample size based on the estimated skew of the population. The process of selecting a random sample, computing mean and standard deviation, estimating standard error, and generating confidence intervals is summarized, highlighting the role of the central limit theorem in these calculations.
📉 Final Thoughts on Sampling and Standard Error
In the final part of the lecture, the professor reflects on the importance of understanding standard error in statistical analysis. The concept is demonstrated through an experiment using temperature data to determine if 200 samples are sufficient for a representative estimate. The experiment results support the theory, showing that with the right sample size, accurate statistical inferences can be made.
Mindmap
Keywords
💡Sampling
💡Inferential Statistics
💡Monte Carlo Simulation
💡Confidence Interval
💡Simple Random Sampling
💡Stratified Sampling
💡Central Limit Theorem
💡Standard Deviation
💡Standard Error
💡Error Bar
💡Skew
Highlights
Introduction to Lecture 8 on the topic of sampling within the context of inferential statistics.
Explanation of how inferential statistics uses random samples to make references about populations.
Discussion on the use of Monte Carlo simulation for finding the value of pi and the concept of confidence intervals.
The importance of probability sampling where each member of the population has a non-zero probability of being included in a sample.
Introduction to simple random sampling ensuring no bias by giving each member of the population an equal chance of being chosen.
The concept of stratified sampling to ensure representation of subgroups in a population.
The use of stratified sampling in political polls and the potential issues with improper stratification.
The benefits of stratified sampling in reducing the needed sample size when done properly.
An example of temperature data analysis from the US Centers for Environmental Information to illustrate sampling techniques.
The use of numpy.std for standard deviations and random.sample for taking simple random samples in data analysis.
Explanation of sampling with and without replacement and their implications.
Demonstration of how the distribution of daily high temperatures in a histogram deviates from a normal distribution.
The central limit theorem's role in explaining the distribution of sample means and its approximation to a normal distribution.
Calculation of the 95% confidence interval for the mean high temperature using the standard deviation of sample means.
Experimentation with different sample sizes to observe the effect on the standard deviation and the implications for confidence intervals.
Introduction to error bars as a method to visualize data variability and their use in representing 95% confidence intervals.
The relationship between the standard error of the mean and the standard deviation of the population, and how it informs sample size decisions.
The impact of the population's skewness on the approximation of the population standard deviation by the sample standard deviation.
The surprising finding that the size of the population does not significantly affect the required sample size for a good approximation.
The process of estimating the population mean from a single sample using the sample mean, standard deviation, and estimated standard error.
The importance of choosing an appropriate sample size based on the population's skew to ensure accurate and economical sampling.
An experiment to test whether 200 samples are sufficient for temperature data, demonstrating the practical application of confidence intervals.
Conclusion on the significance of understanding standard error in statistical sampling and its importance in various fields including political polling.
Transcripts
Browse More Related Video

Introduction to sampling distributions | Sampling distributions | AP Statistics | Khan Academy
6.3.1 Sampling Distributions and Estimators - Sampling Distributions Described and Defined
Sampling Distributions: Introduction to the Concept
6.3.3 Sampling Distributions and Estimators - Sampling Distribution of the Sample Means
Central Limit Theorem & Sampling Distribution Concepts | Statistics Tutorial | MarinStatsLectures
The Central Limit Theorem - understanding what it is and why it works
5.0 / 5 (0 votes)
Thanks for rating: