Confidence Interval Concept Explained | Statistics Tutorial #7 | MarinStatsLectures
TLDRThis video delves into the concept of sampling distribution and its role in constructing confidence intervals, particularly for a single mean. It explains how, under certain conditions, the sample mean follows an approximately normal distribution centered around the true population mean. The video uses the example of systolic blood pressure to illustrate how a sample mean is likely to fall within two standard deviations of the true mean with a 95% confidence interval. It emphasizes the practical application of these concepts when the true population parameters are unknown, and we rely on sample data to make inferences about the population. The video also touches on the transition from using Z-scores to t-values when the population standard deviation is unknown, setting the stage for a deeper discussion on confidence intervals in subsequent videos.
Takeaways
- 📊 The concept of a sampling distribution is crucial for building confidence intervals, particularly for a single mean.
- 🧠 Understanding sample estimates' behavior in relation to the true population parameters is fundamental when the population parameters are known.
- 💡 The sampling distribution of sample means is approximately normally distributed when certain conditions are met, with the sample mean expected to equal the population mean.
- 📈 The standard error of the mean (SEM) measures the average distance the sample mean estimate moves away from the true mean and is calculated to be 4 in the given example.
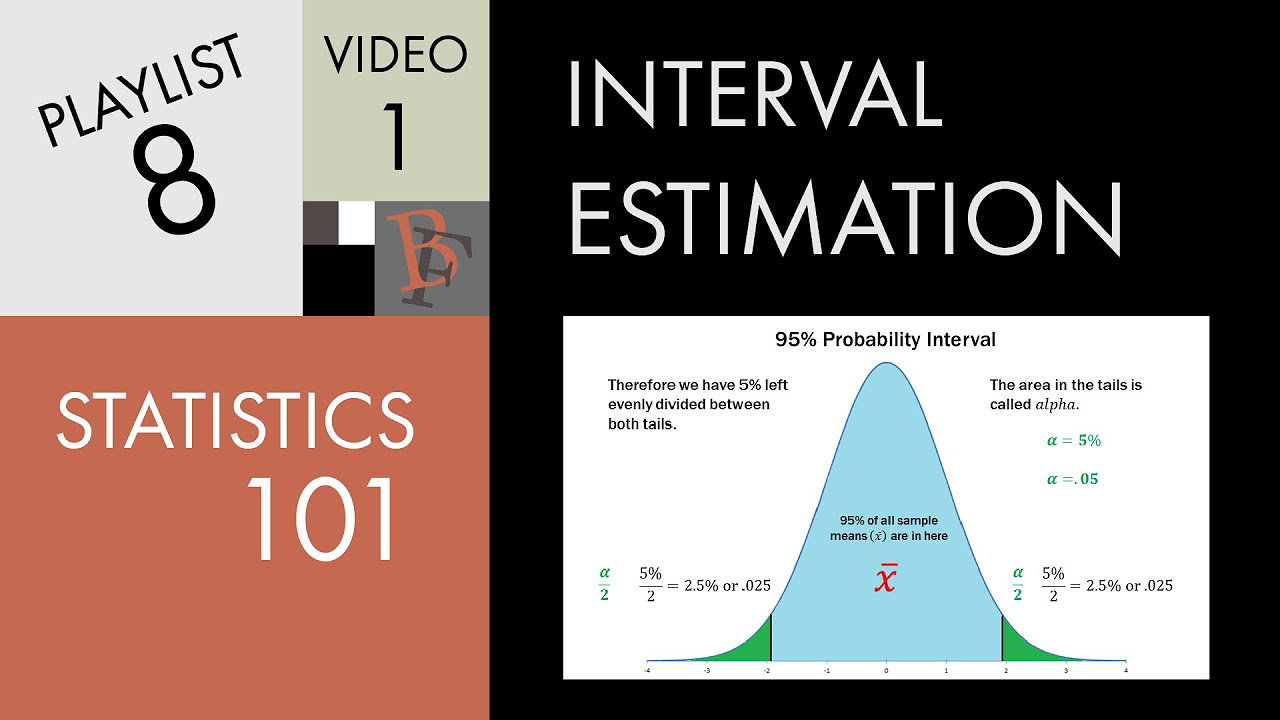
- 🔢 The 68-95-99.7 rule (empirical rule) states that approximately 95% of sample means fall within two standard deviations of the mean in a normal distribution.
- 🔮 This rule implies that roughly 95% of the time, the true population mean will be within two standard deviations of the sample mean estimate.
- 🤔 In practice, we often do not know the true population parameters, so we use sample data to make inferences about the population.
- 🔄 The idea of 'confidence' in a confidence interval means that if we were to repeat the sampling process, 95% of the time our interval will contain the true population mean.
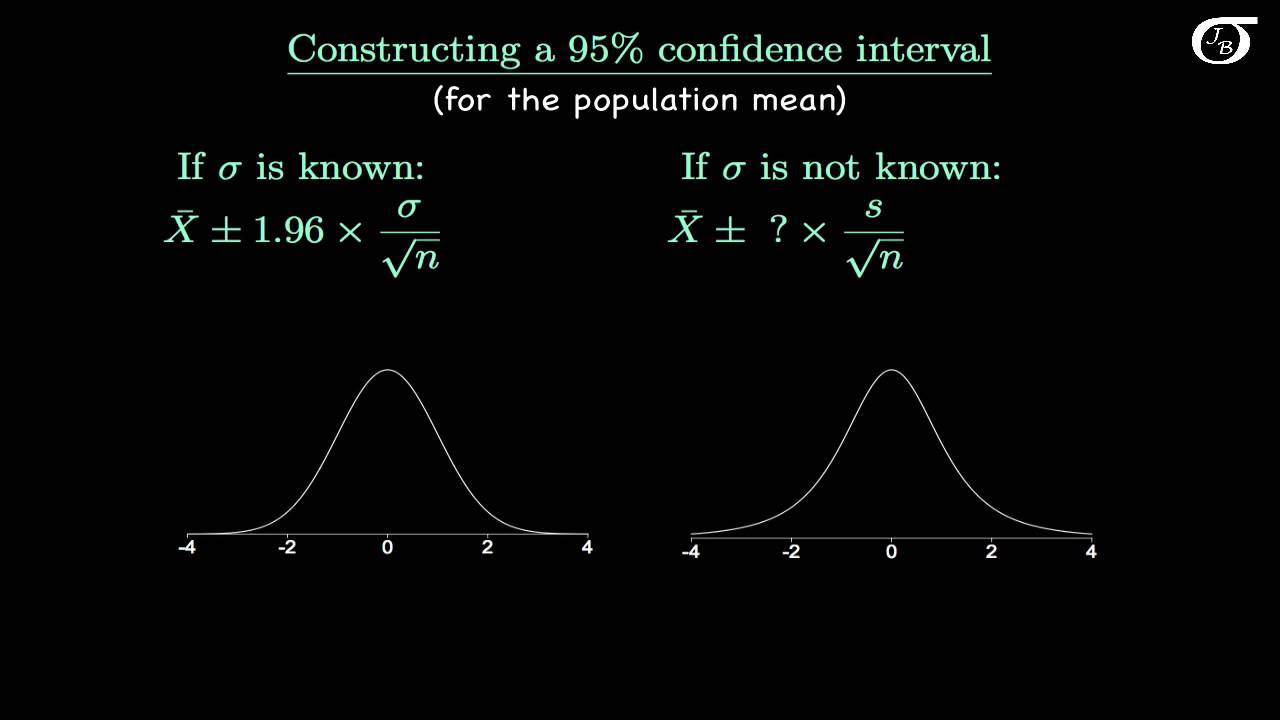
- 🌐 When constructing a confidence interval, we replace the population standard deviation with the sample standard deviation and use a t-value instead of a z-score.
- 📝 The statement of a confidence interval (e.g., 95% confidence) does not equate to a probability but rather an expression of confidence that the interval overlaps with the true population mean.
Q & A
What is the main concept discussed in the video?
-The main concept discussed in the video is the construction of a confidence interval for a single mean using the idea of a sampling distribution.
What is a sampling distribution?
-A sampling distribution describes all the possible estimates (sample means) that could be obtained from a population by taking random samples under certain conditions.
What are the conditions for the sample mean to be approximately normally distributed?
-The sample mean is approximately normally distributed when the population is large, and the sample size is sufficiently large, typically n ≥ 30.
What is the standard error of the mean?
-The standard error of the mean is a measure that gives an idea of how much the sample mean is expected to vary from the true population mean, on average.
What is the 68-95-99.7 rule?
-The 68-95-99.7 rule, also known as the empirical rule, states that in a normal distribution, approximately 68% of the data falls within one standard deviation of the mean, 95% within two standard deviations, and 99.7% within three standard deviations.
How does the video illustrate the relationship between the sample mean and the population mean?
-The video illustrates that approximately 95% of the time, the sample mean will be within two standard deviations of the population mean, suggesting that we can estimate the population mean with a certain level of confidence based on the sample mean.
Why can't we always know the true mean or standard deviation of a population?
-In the real world, we often don't have access to the entire population data. Instead, we collect a sample of data and use that to make inferences about the population parameters.
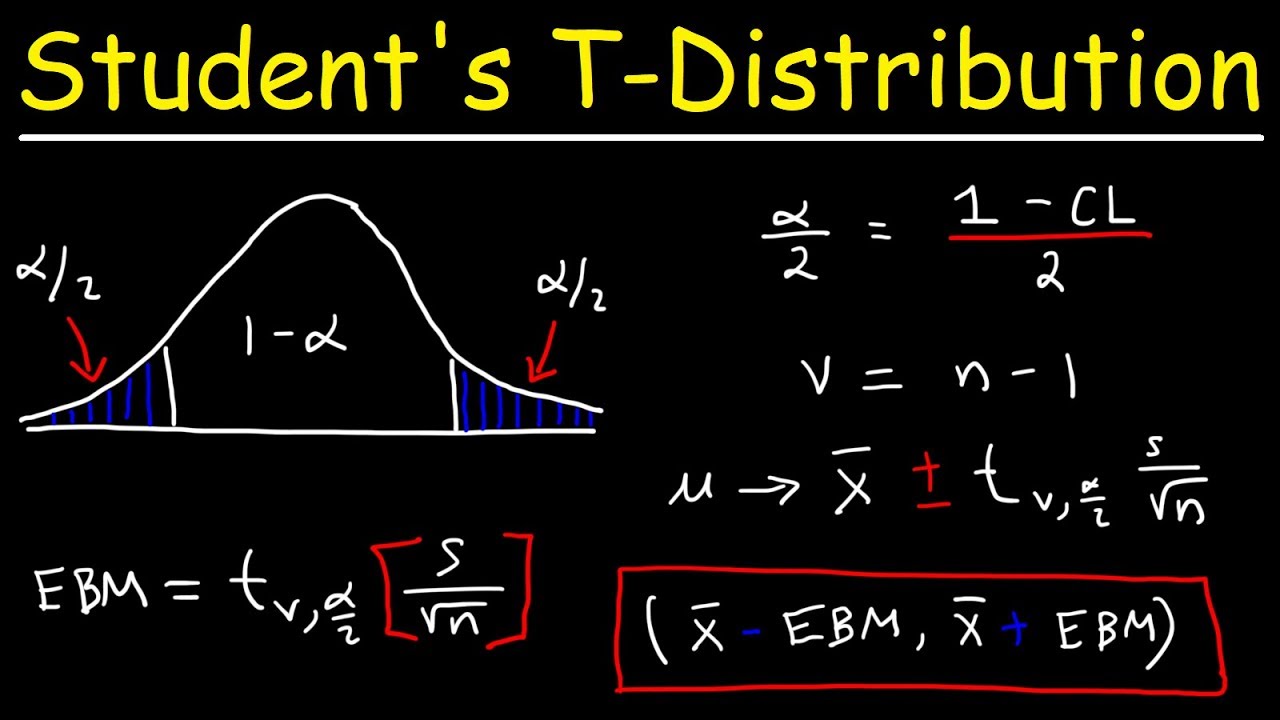
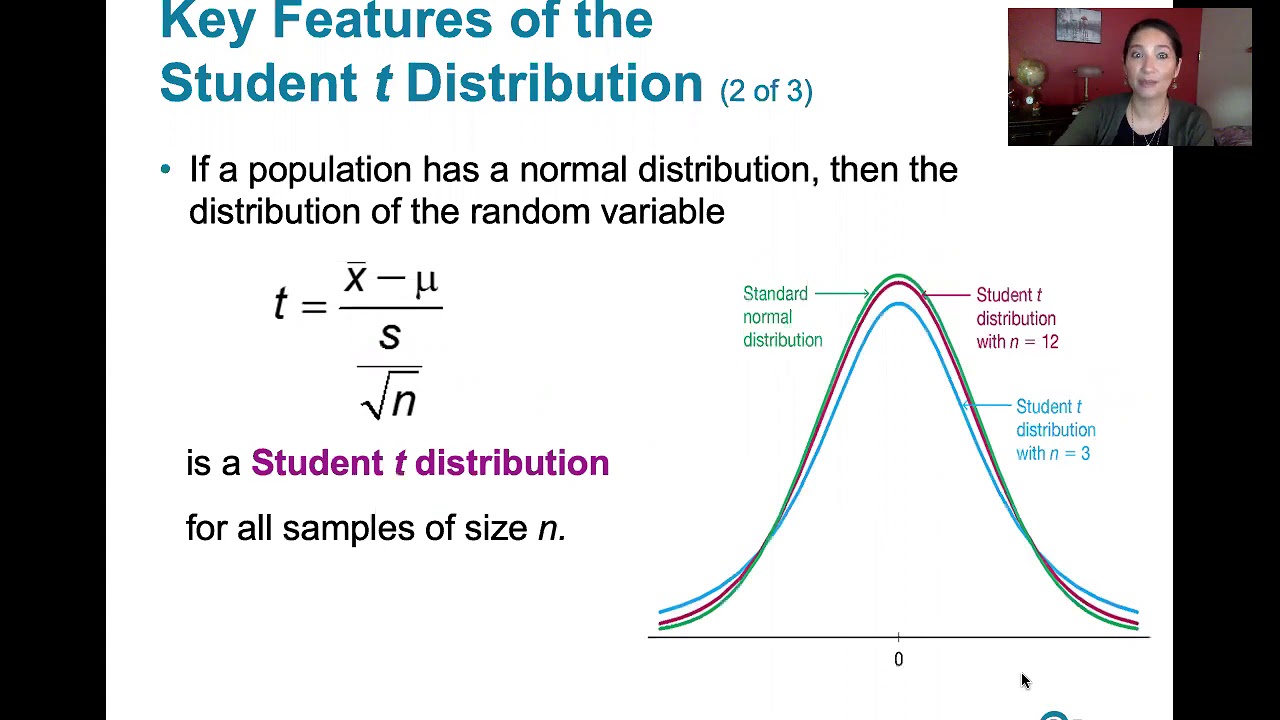
What is the significance of the t-value in the context of confidence intervals?
-The t-value is used in place of the Z-score when the population standard deviation is unknown and is estimated by the sample standard deviation. It accounts for the additional uncertainty in the estimate of the population mean.
How does the video explain the concept of confidence in relation to confidence intervals?
-The video explains that when we construct a confidence interval, we are stating that we are 'x% confident' that the interval contains the true population mean, not that there is an 'x% chance' the true mean is in the interval. This reflects the fact that we can only estimate the population parameters based on our sample data.
What is the role of the sample size in determining the precision of the confidence interval?
-The larger the sample size, the more precise the confidence interval becomes. This is because a larger sample size provides a more accurate estimate of the population parameters and reduces the variability of the sample mean.
How does the video relate the concept of confidence intervals to real-world applications?
-The video emphasizes that in real-world applications, we use sample data to make statements about the population. Confidence intervals provide a range within which we can estimate the population mean with a certain level of confidence, based on our sample data.
Outlines
📊 Understanding Sampling Distribution and Confidence Intervals
This paragraph introduces the concept of a sampling distribution and its role in constructing a confidence interval for a single mean. It explains how sample estimates behave when the true population parameters are known, using an example of systolic blood pressure. The discussion focuses on the sampling distribution's approximate normality under certain conditions and introduces the standard error of the mean. The paragraph also delves into the 68-95-99.7 rule, illustrating that 95% of sample means fall within two standard deviations of the population mean. The idea is extended to infer that the population mean is likely within two standard deviations of the sample mean in 95% of the cases.
🔍 Generalizing Confidence Intervals and Addressing Real-World Scenarios
The second paragraph discusses the practical application of confidence intervals in situations where the true population mean and standard deviation are unknown. It emphasizes the shift from using the Z-score to the t-score when the population standard deviation is replaced with the sample standard deviation. The paragraph clarifies that confidence intervals do not quantify the probability of the true population mean being within the interval but rather express a level of confidence that the interval contains the population mean. It sets the stage for a deeper exploration of confidence intervals and the T distribution in subsequent content.
Mindmap
Keywords
💡Sampling Distribution
💡Confidence Interval
💡Standard Error of the Mean
💡Standard Deviation
💡Population Mean
💡Sample Mean
💡Estimate
💡True Distribution
💡Two Standard Deviations
💡T-Value
💡Confidence Level
Highlights
The video discusses the concept of a sampling distribution and its role in constructing a confidence interval for a single mean.
The example given involves the systolic blood pressure in a population with a known skewed distribution, mean, and standard deviation.
A sample of 25 is taken from the population, and the sample mean is calculated.
The theoretical sampling distribution of all possible sample means is approximately normally distributed when certain conditions are met.
The sample mean is expected to be equal to the true mean of the population, with the standard deviation of the mean referred to as the standard error of the mean.
The video introduces the 68-95-99.7 rule, explaining that approximately 95% of sample means fall within two standard deviations of the mean.
The concept is extended to the idea that 95% of the time, the true mean will be within two standard deviations of the sample mean estimate.
A visual representation is provided to illustrate how the sample means cluster around the true mean.
The video acknowledges the reality that we often do not know the true distribution, mean, or standard deviation of a population.
The usefulness of the sampling distribution is emphasized, even when the true values are unknown.
The video explains the concept of using the sample standard deviation instead of the population standard deviation when estimating the population mean.
The use of t-values instead of z-scores is introduced when the population standard deviation is unknown.
The video clarifies that confidence intervals do not state a probability that the true population mean is within the interval, but rather a level of confidence.
The distinction between probability and confidence in the context of confidence intervals is explained.
The video concludes by stating that more details on confidence intervals will be discussed in future videos.
Transcripts
Browse More Related Video
Introduction to the t Distribution (non-technical)
Student's T Distribution - Confidence Intervals & Margin of Error
Confidence Intervals | Population Mean: σ Unknown
Statistics 101: Confidence Interval Estimation, Sigma Known
7.2.1 Estimating a Population Mean - Student t Distribution and Finding Critical t Values
2610 Chapter 8 Day 1
5.0 / 5 (0 votes)
Thanks for rating: