Confidence Interval [Simply explained]
TLDRThis tutorial explains the concept of confidence intervals in statistics. It covers how confidence intervals estimate population parameters like the mean, based on sample data. The tutorial discusses the variability of sample means and introduces the formula for calculating confidence intervals for normally distributed data. It highlights the common confidence levels of 95% and 99% and explains how to use the Z value from statistical tables. The video aims to help viewers understand how confidence intervals provide a range in which the true parameter value is likely to be found with a certain probability.
Takeaways
- 📊 Confidence Interval is a statistical concept used to estimate population parameters based on sample data.
- 🔍 Population parameters like mean or variance are often unknown and are estimated using samples.
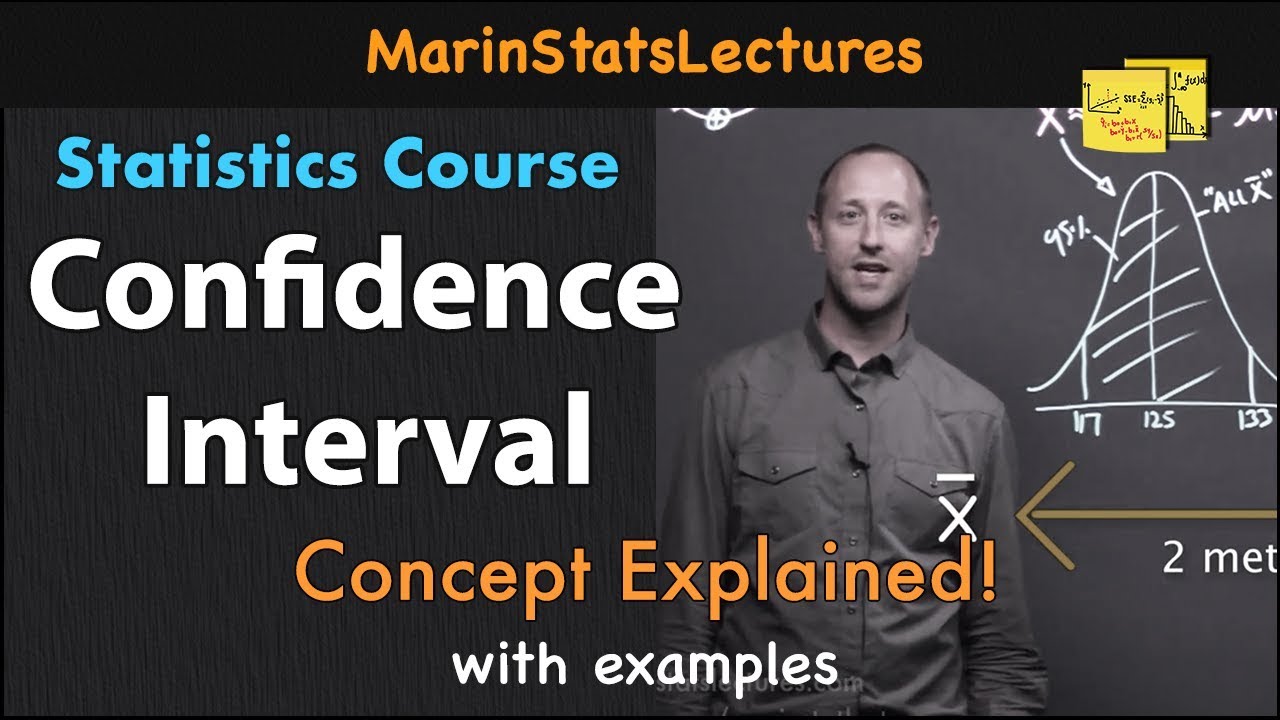
- 🏀 Example given: Estimating the height of all professional basketball players in the US by drawing a sample.
- ⚖️ Each sample may have a different mean, and the true population mean is likely to be within a range of these sample means.
- 🎯 The confidence interval provides a range where the true population mean is likely to be found with a certain probability.
- 💯 Commonly used confidence levels are 95% or 99%, indicating the level of certainty that the true parameter is within the interval.
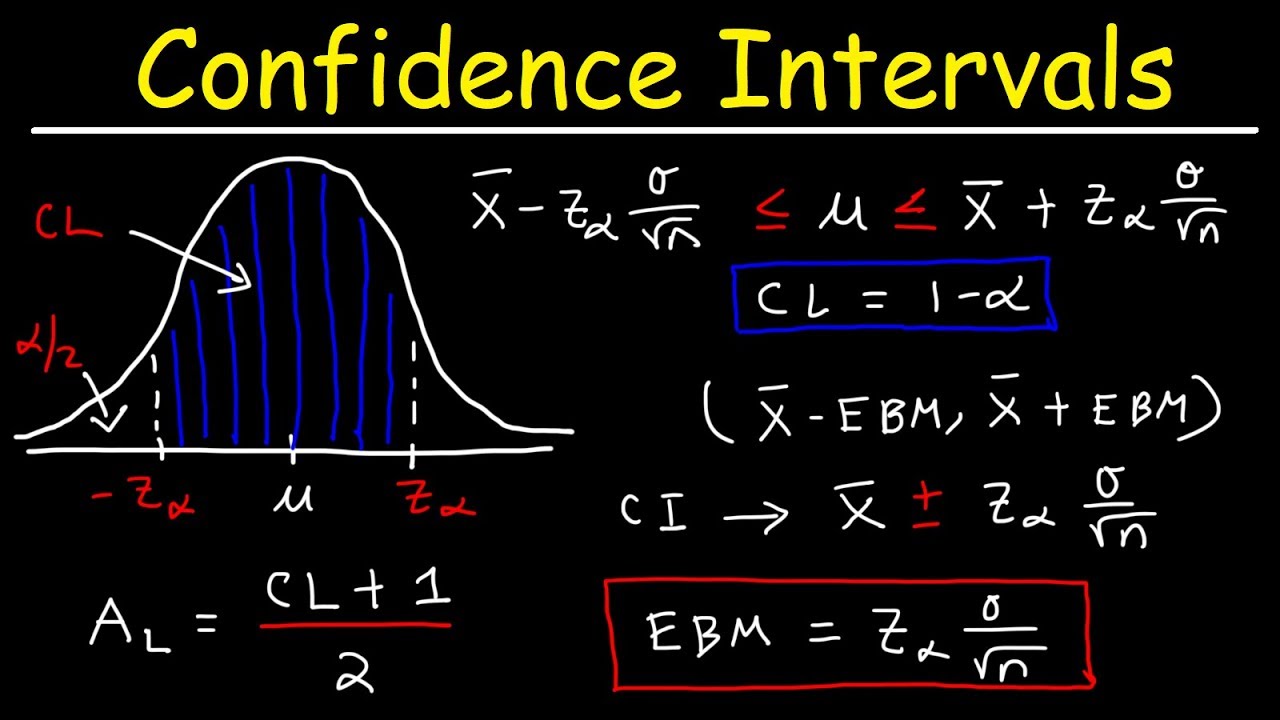
- 📚 The formula for calculating the confidence interval for the mean of normally distributed data is given as \( \bar{x} \pm z \times \frac{s}{\sqrt{n}} \).
- 📉 'z' is the z-score which corresponds to the desired confidence level and can be found in a standard normal distribution table.
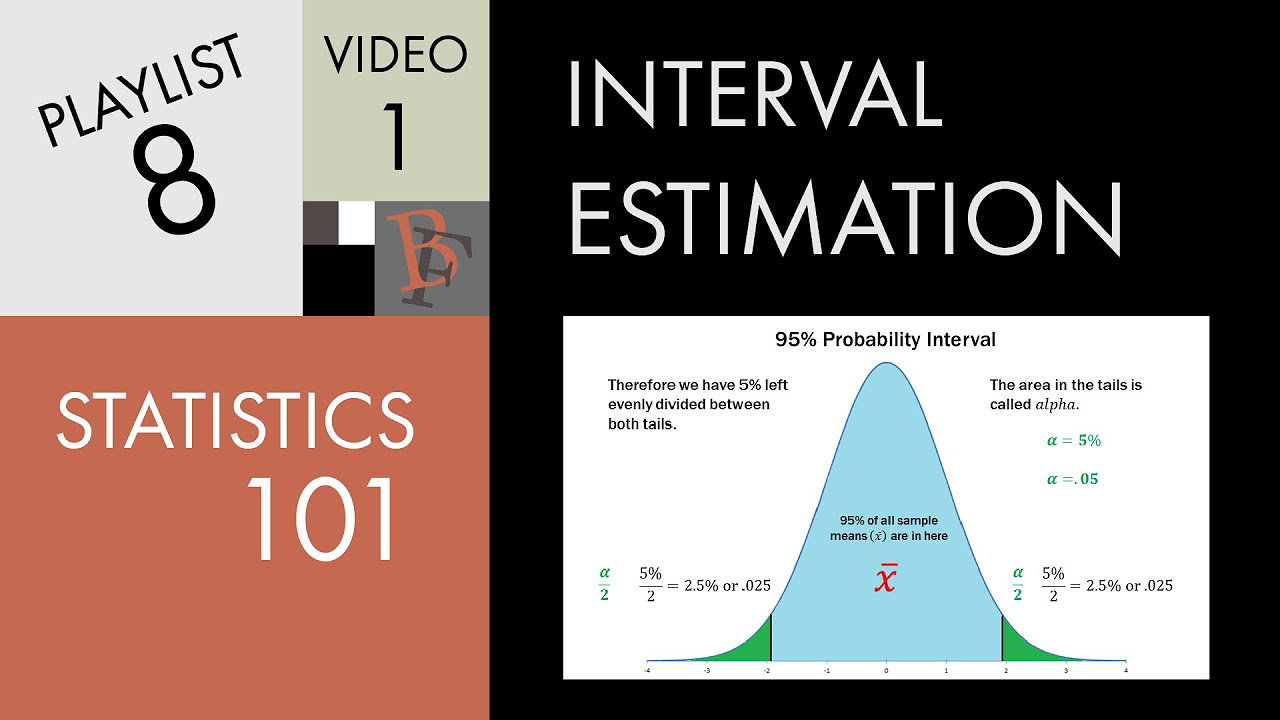
- 📊 The lower and upper bounds of the confidence interval can be visualized on a normal distribution curve.
- 🔢 For a 95% confidence level, the z-score is 1.96, which influences the width of the confidence interval.
- 🌐 The concept of confidence intervals applies to various statistical parameters, not just the mean.
Q & A
What is a confidence interval in statistics?
-A confidence interval is a range in which the true parameter value of a population, such as the mean or variance, is likely to be found with a certain probability.
Why is it often not possible to survey the entire population?
-In most cases, it is impractical or impossible to survey the entire population due to constraints like time, cost, and accessibility, so a sample is drawn instead.
How does drawing multiple samples help in understanding the population mean?
-Drawing multiple samples helps to understand the variability in sample means and provides a way to estimate the range in which the true population mean is likely to lie.
Why do different samples often have different means?
-Different samples often have different means due to random variations and differences in the sampled data points.
What does the confidence interval tell us about the true mean of the population?
-The confidence interval provides a range within which the true mean of the population is most likely to be found with a specified probability, such as 95% or 99%.
What is a commonly used confidence level, and what does it indicate?
-Commonly used confidence levels are 95% and 99%, indicating that there is a 95% or 99% probability, respectively, that the true parameter value lies within the confidence interval.
What is the formula for calculating the confidence interval for the mean of normally distributed data?
-The formula for the confidence interval for the mean of normally distributed data is x̄ ± z * (s / √n), where x̄ is the sample mean, z is the z-value for the confidence level, s is the standard deviation, and n is the sample size.
How do you determine the z-value for a specific confidence level?
-The z-value for a specific confidence level can be found in a table of z-values. For example, the z-value for a 95% confidence level is 1.96.
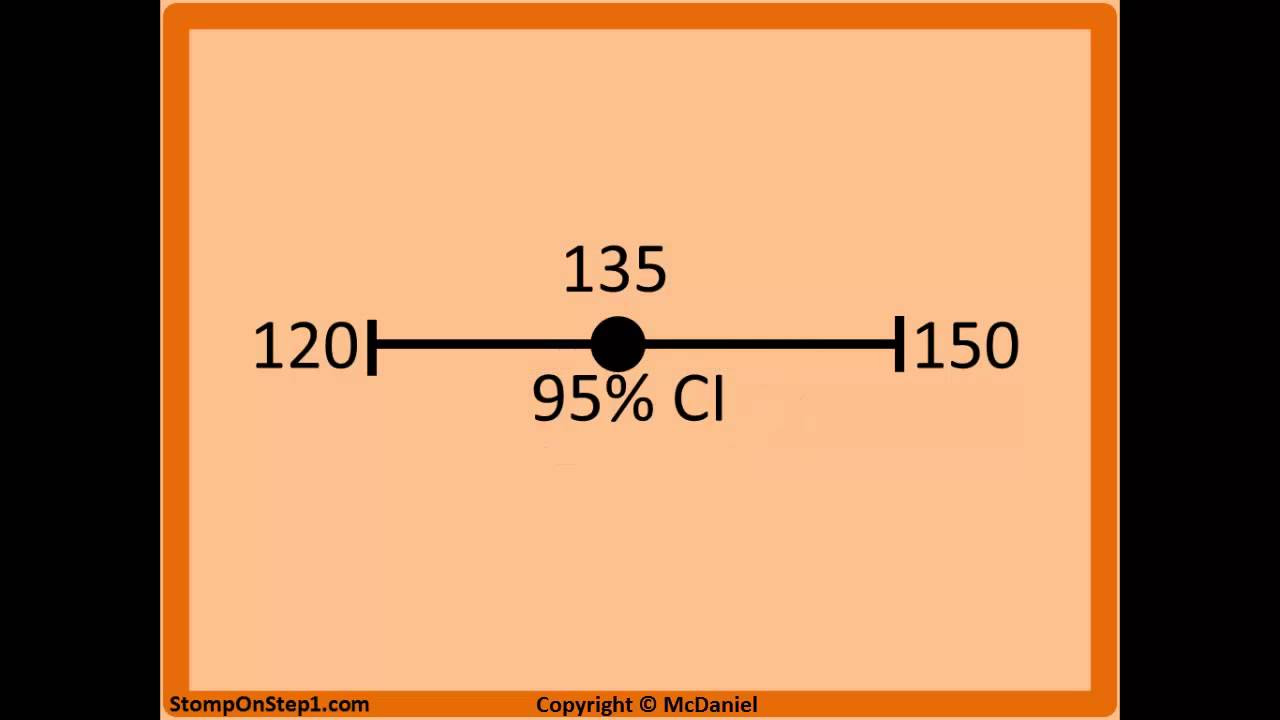
What do the lower and upper limits of the confidence interval represent?
-The lower limit is calculated as x̄ - z * (s / √n) and the upper limit is x̄ + z * (s / √n). These limits define the range of the confidence interval where the true parameter value is likely to be found.
Can the confidence interval be calculated for parameters other than the mean?
-Yes, the confidence interval can be calculated for many statistical parameters, not just the mean, to estimate their range with a certain probability.
Outlines
📊 Understanding Confidence Intervals in Statistics
This paragraph introduces the concept of confidence intervals in statistics. It explains that population parameters, such as the mean or variance, are often estimated using samples due to the impracticality of surveying entire populations. The paragraph uses the example of estimating the height of all professional basketball players in the US to illustrate the concept. It discusses the variability in sample means and the importance of establishing a range, the confidence interval, where the true population mean is likely to fall with a certain probability. The paragraph also mentions that a high probability, often 95% or 99%, is set as the confidence level to ensure that the true parameter value is within the interval with that level of certainty. The formula for calculating the confidence interval for the mean of normally distributed data is provided, along with an explanation of how to visualize it using the normal distribution curve. The paragraph concludes by explaining how to determine the 'set' value for the confidence interval from statistical tables, using a 95% confidence level as an example where the 'set' value is 1.96.
🔍 Summarizing the Role of Confidence Intervals
The second paragraph serves as a conclusion to the tutorial, summarizing the purpose of confidence intervals. It reiterates that confidence intervals provide a range within which a parameter is estimated to lie with a certain level of probability, such as 95%. The paragraph encourages viewers to explore more tutorials on datadept.net for further learning and provides a call to action to either search for 'datatab' on Google or use the link provided in the video description. The tutorial ends with a farewell note.
Mindmap
Keywords
💡Confidence Interval
💡Population
💡Sample
💡Parameter Estimation
💡Mean
💡Variance
💡Normal Distribution
💡Standard Deviation
💡Sample Size
💡Confidence Level
💡Z-score
Highlights
A confidence interval is a range within which a population parameter is estimated to lie with a certain probability.
Population parameters like mean or variance are often estimated based on a sample due to the impracticality of surveying the entire population.
Multiple samples can be drawn, each likely showing a different mean.
The confidence interval helps to estimate where the true population mean is likely to be found.
A high probability or confidence level, such as 95% or 99%, is defined beforehand for the calculation of the confidence interval.
A 95% confidence interval implies that there is a 95% chance that the true parameter value lies within the interval.
The formula for the confidence interval for the mean of normally distributed data is x-bar ± z*(s/√n).
x-bar represents the sample mean, s is the standard deviation, and n is the sample size in the formula.
The z-value is derived from the normal distribution curve and corresponds to the desired confidence level.
For a 95% confidence level, the z-value is typically 1.96.
The confidence interval can be visualized on the normal distribution curve by marking the lower and upper limits.
The lower bound is calculated as x-bar - z*(s/√n), and the upper bound as x-bar + z*(s/√n).
The range between the lower and upper limits represents the confidence interval.
If a 95% confidence level is selected, it means that 95% of all values lie within this range.
The z-value for the confidence interval can be found in a table corresponding to the chosen confidence level.
The confidence interval is not limited to the mean value but can be calculated for various statistical parameters.
The tutorial is available on datadept.net for further learning and exploration.
The tutorial concludes by summarizing that the confidence interval indicates the range within which a parameter lies with a certain probability.
Transcripts
Browse More Related Video
Statistics 101: Confidence Interval Estimation, Sigma Known
How To Find The Z Score, Confidence Interval, and Margin of Error for a Population Mean
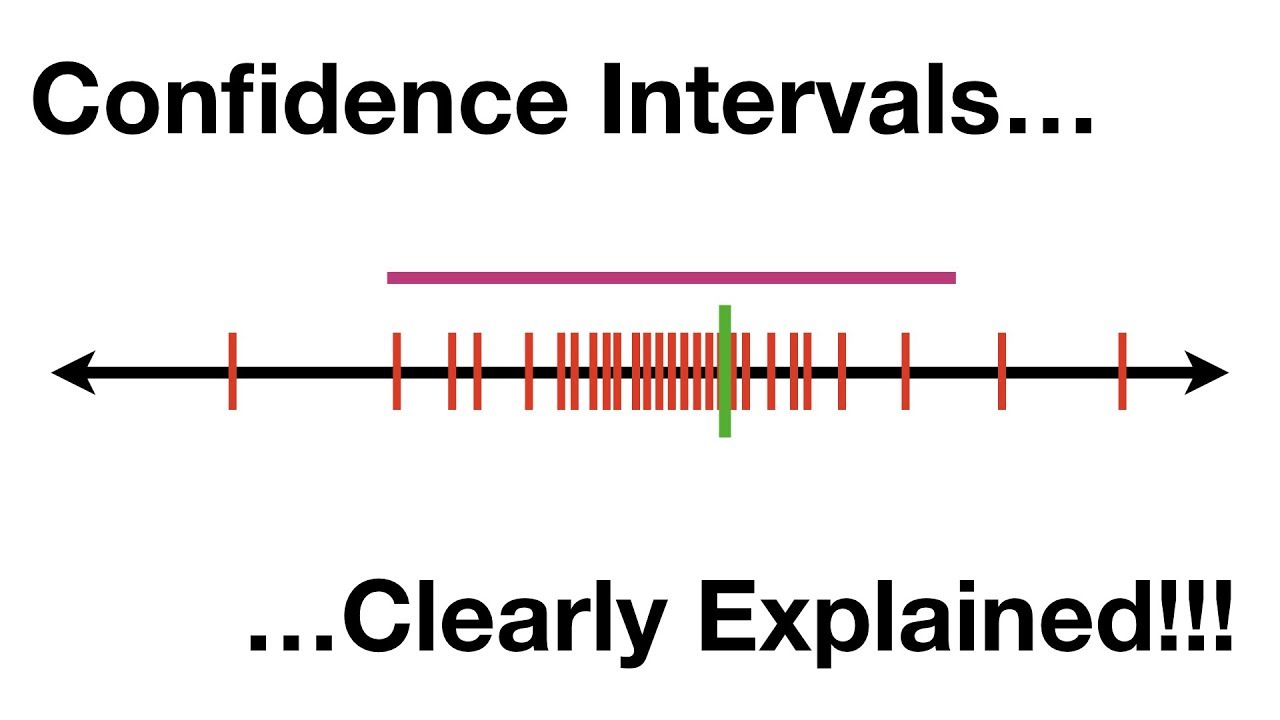
Confidence Intervals, Clearly Explained!!!
Confidence Intervals: Crash Course Statistics #20
Confidence Interval Concept Explained | Statistics Tutorial #7 | MarinStatsLectures
Confidence Interval Interpretation. 95% Confidence Interval 90% 99%
5.0 / 5 (0 votes)
Thanks for rating: