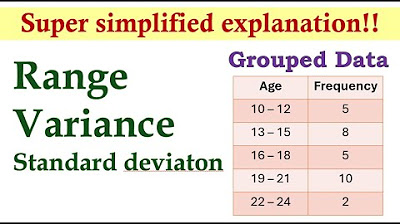
Mean deviation, variance and standard deviation of grouped data.
TLDRThis tutorial video guides viewers through calculating the mean, mean deviation, variance, and standard deviation of grouped data, using a dataset of students' recorded weights. The presenter demonstrates the process step-by-step, from finding the midpoints of class intervals to summing products of frequency and midpoint values, and finally applying the respective formulas to derive the statistical measures. The video concludes by encouraging viewers to subscribe to the YouTube channel for more educational content.
Takeaways
- 📚 The tutorial focuses on calculating statistical measures for grouped data, specifically mean, mean deviation, variance, and standard deviation.
- 🔢 To find the mean, the formula used is the summation of frequency times the mid-value (FX) divided by the summation of frequencies (F).
- 📉 The mid-value (X) for each class interval is calculated by taking the average of the lower and upper bounds of the interval.
- 📈 The FX value is obtained by multiplying the frequency (F) of each class interval by its respective mid-value (X).
- 🧮 The summation of frequencies and the summation of FX are used to calculate the mean of the distribution, which in this case is 66.94 kg.
- 📊 Mean deviation is calculated by summing the absolute values of the difference between each X and the mean (X-bar), multiplied by their respective frequencies, and then dividing by the total frequency.
- ➗ The formula for variance involves summing the squared differences between each X and X-bar, multiplied by their frequencies, and then dividing by the total frequency.
- 📐 The standard deviation is the square root of the variance, providing a measure of the dispersion of the data points around the mean.
- 📝 Additional columns for X, FX, absolute value of X - X-bar, and the product of frequency and X - X-bar are created to facilitate calculations.
- 📉 The tutorial provides step-by-step calculations for each statistical measure, ensuring a clear understanding of the process.
- 📚 The final calculated values for the distribution are a mean of 66.94 kg, a mean deviation of 5.7472, a variance of 51.2064, and a standard deviation of approximately 7.1559.
Q & A
What is the main topic of the tutorial?
-The main topic of the tutorial is the calculation of mean, mean deviation, variance, and standard deviation for grouped data in statistics.
What is the first step in calculating the mean of grouped data?
-The first step is to calculate the mid-value (X) for each class interval, which represents the average value of the data within that interval.
How is the mid-value of a class interval calculated?
-The mid-value of a class interval is calculated by adding the lower and upper bounds of the interval and dividing by 2.
What does 'FX' represent in the context of the tutorial?
-'FX' represents the product of the frequency (F) and the mid-value (X) of a class interval.
What is the formula used to calculate the mean of grouped data?
-The formula used to calculate the mean of grouped data is the summation of FX divided by the summation of F.
What is the mean weight calculated in the tutorial?
-The mean weight calculated in the tutorial is 66.94 kg.
How is mean deviation calculated for grouped data?
-Mean deviation is calculated by summing the absolute values of the difference between each mid-value (X) and the mean (X̄), multiplied by the frequency, and then dividing by the total frequency.
What is the mean deviation of the distribution in the tutorial?
-The mean deviation of the distribution in the tutorial is 5.7472.
How is variance calculated for grouped data?
-Variance is calculated by summing the squares of the differences between each mid-value (X) and the mean (X̄), multiplied by the frequency, and then dividing by the total frequency.
What is the variance of the distribution in the tutorial?
-The variance of the distribution in the tutorial is 51.2064.
How is standard deviation derived from variance?
-Standard deviation is derived from variance by taking the square root of the variance value.
What is the standard deviation of the distribution in the tutorial?
-The standard deviation of the distribution in the tutorial is approximately 7.1559.
Outlines
📊 Introduction to Calculating Statistics for Grouped Data
The video tutorial introduces the topic of calculating the mean, mean deviation, variance, and standard deviation for grouped data. The example problem involves calculating these statistics for weights recorded in kilograms by final-year students. The mean is calculated using the summation of FX over the summation of F, and additional columns for mid-values (X) and the product of frequency and mid-values (FX) are created.
🔢 Calculating Mean Deviation
The process for calculating mean deviation is explained. The mean deviation formula involves the summation of the absolute value of X - mean (X̄) multiplied by the frequency, divided by the summation of the frequency. Additional columns for the absolute difference and the product of this difference with the frequency are created. The tutorial then substitutes the values into the mean deviation formula to get the result.
📐 Calculating Variance and Standard Deviation
This section covers the calculation of variance and standard deviation. The variance is calculated using the formula that involves squaring the differences (X - X̄) and multiplying by the frequency. A new column for these squared differences multiplied by the frequency is created, summed, and substituted into the variance formula. The standard deviation is then found by taking the square root of the variance. The final results for variance and standard deviation are provided, concluding the tutorial.
Mindmap
Keywords
💡Statistics
💡Grouped Data
💡Mean
💡Mean Deviation
💡Variance
💡Standard Deviation
💡Class Interval
💡Frequency
💡Mid-Value
💡FX
💡Absolute Value
Highlights
Introduction to the tutorial on statistics for grouped data.
Explanation of terms like mean, mean deviation, variance, and standard deviation.
Demonstration of calculating the mean using the formula summation of FX over summation of F.
Creation of additional columns for X (mid-value) and FX (frequency multiplied by X) for grouped data.
Calculation of the mid-value for each class interval to represent X.
Determination of FX by multiplying frequency by the mid-value.
Summation of frequency and the product of frequency and X to find the mean.
Calculation of the mean weight distribution as 66.94 kg.
Introduction to mean deviation and its formula.
Calculation of absolute values of x - x-bar for each class interval.
Determination of the product of frequency and the absolute value of x - x-bar.
Calculation of the mean deviation of the distribution as 5.7472.
Explanation of variance calculation using the formula summation of F(x - x-bar) squared.
Process of squaring the differences and multiplying by frequency for variance calculation.
Summation of squared differences multiplied by frequency to find the variance.
Calculation of the variance of the distribution as 51.2064.
Introduction to standard deviation as the square root of variance.
Calculation of the standard deviation as 7.1559.
Conclusion of the tutorial with a summary of calculated statistics.
Encouragement to subscribe to the YouTube channel for more educational content.
Transcripts
Browse More Related Video
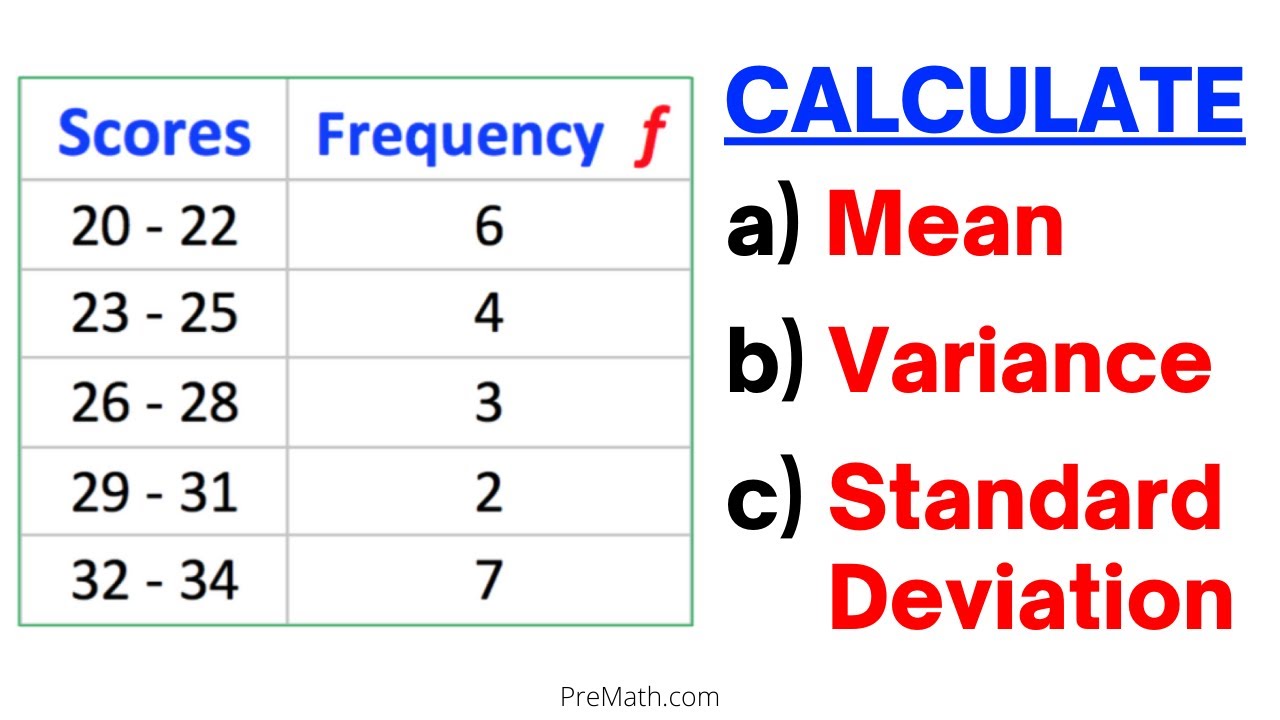
Can You Find Mean, Variance, & Standard Deviation of a Frequency Grouped DataTable? Simple Tutorial
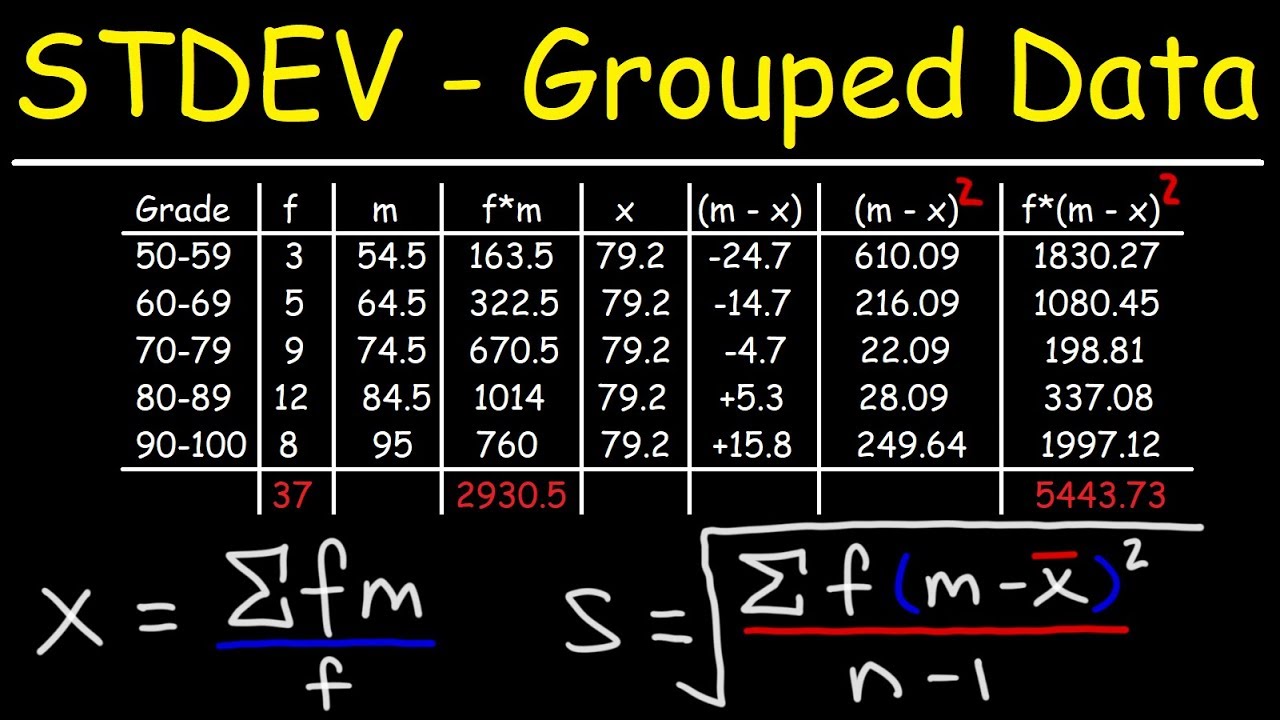
How To Calculate The Standard Deviation of Grouped Data
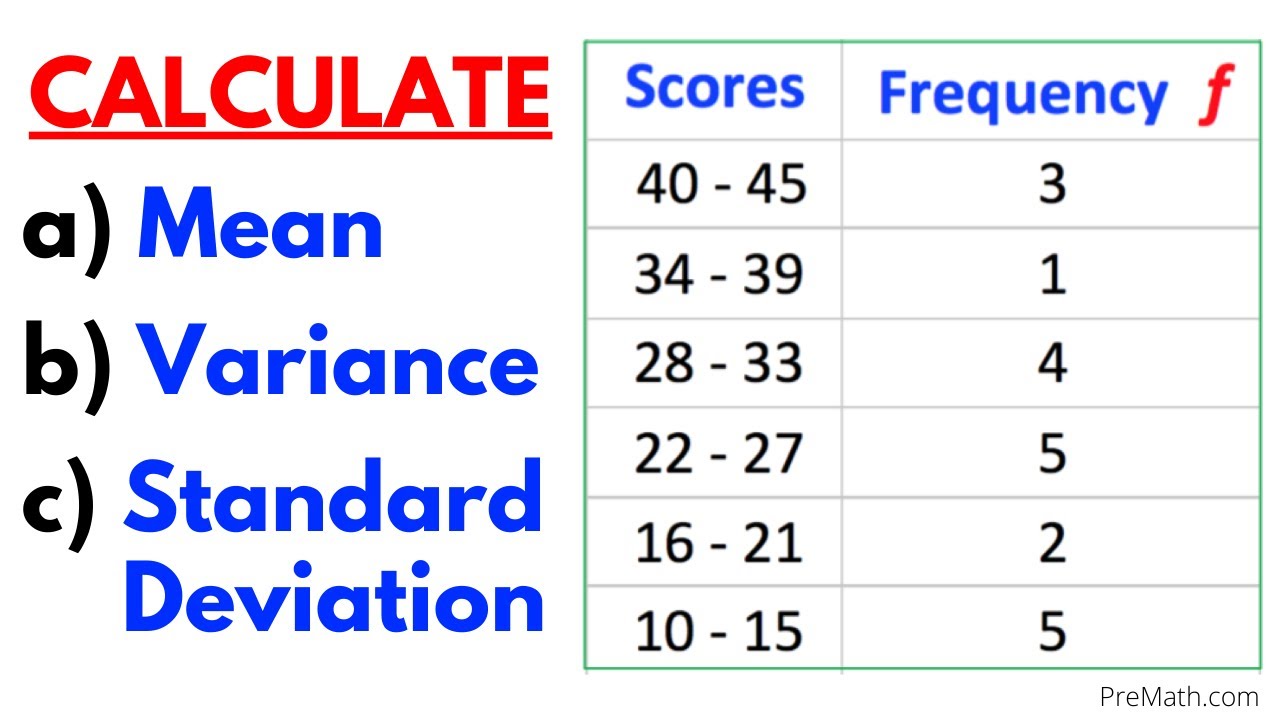
Find the Mean, Variance, & Standard Deviation of Frequency Grouped Data Table| Step-by-Step Tutorial
Variance - Clearly Explained (How To Calculate Variance)
Measures of Dispersion (Grouped Data) | Basic Statistics
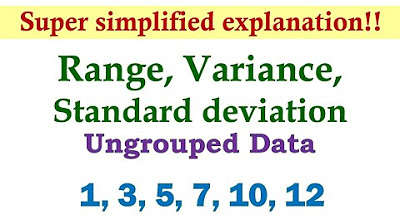
Measures of Dispersion (Ungrouped Data) | Basic Statistics
5.0 / 5 (0 votes)
Thanks for rating: