Introduction to the t Distribution (non-technical)
TLDRThis video introduces the Student t-distribution, commonly used when estimating population parameters like the mean when the population standard deviation is unknown. It explains that instead of using the population standard deviation, we use the sample standard deviation, which leads to a t-distribution with n-1 degrees of freedom. The t-distribution resembles the standard normal distribution but has heavier tails and a lower peak, indicating more variability. As degrees of freedom increase, the t-distribution approaches the standard normal distribution. The video also discusses the implications for constructing confidence intervals, emphasizing the importance of using t-values instead of z-values when the population standard deviation is unknown, regardless of sample size.
Takeaways
- 📚 The video introduces the Student t distribution, often just called the t distribution, with a focus on its application rather than mathematical derivations.
- 🔍 The t distribution is used when estimating the population mean from a sample, particularly when the population standard deviation (sigma) is unknown.
- 📉 In place of sigma, the sample standard deviation (s) is used, leading to a new statistic, which follows the t distribution rather than the standard normal distribution.
- 🔑 The t distribution is characterized by its degrees of freedom, which is typically the sample size minus one (n-1).
- 📊 The t distribution resembles the standard normal distribution but has heavier tails and a lower peak, indicating more variability.
- 📈 As the degrees of freedom increase, the t distribution approaches the standard normal distribution, becoming almost identical at high degrees of freedom.
- 📝 The shape of the t distribution and the values used in statistical inference, such as constructing confidence intervals, depend on the degrees of freedom.
- 📉 When constructing a 95% confidence interval and the population standard deviation is unknown, the t distribution must be used instead of the standard normal distribution.
- 🔢 The appropriate t value for a confidence interval is found using a t table or software, and it varies with the degrees of freedom and the desired confidence level.
- 🚫 Contrary to some opinions, even with large sample sizes, it is important to use the t distribution rather than the standard normal distribution when estimating with sample data.
- 📋 The video emphasizes the importance of using the correct statistical methods based on the data's characteristics, such as whether the population standard deviation is known or not.
Q & A
What is the t distribution?
-The t distribution, often shortened to 't', is a type of probability distribution that is used when estimating the mean of a normally distributed population when the population standard deviation is unknown. It is similar to the standard normal distribution but has heavier tails and a lower peak, accounting for greater variability when using sample standard deviation instead of the population standard deviation.
Why do we use the sample standard deviation instead of the population standard deviation in practice?
-In practice, the population standard deviation (sigma) is often unknown, which makes it impossible to use directly in formulas. Therefore, we use the sample standard deviation (s) as an estimate for sigma to construct confidence intervals and perform statistical inference.
What is the formula for the t statistic?
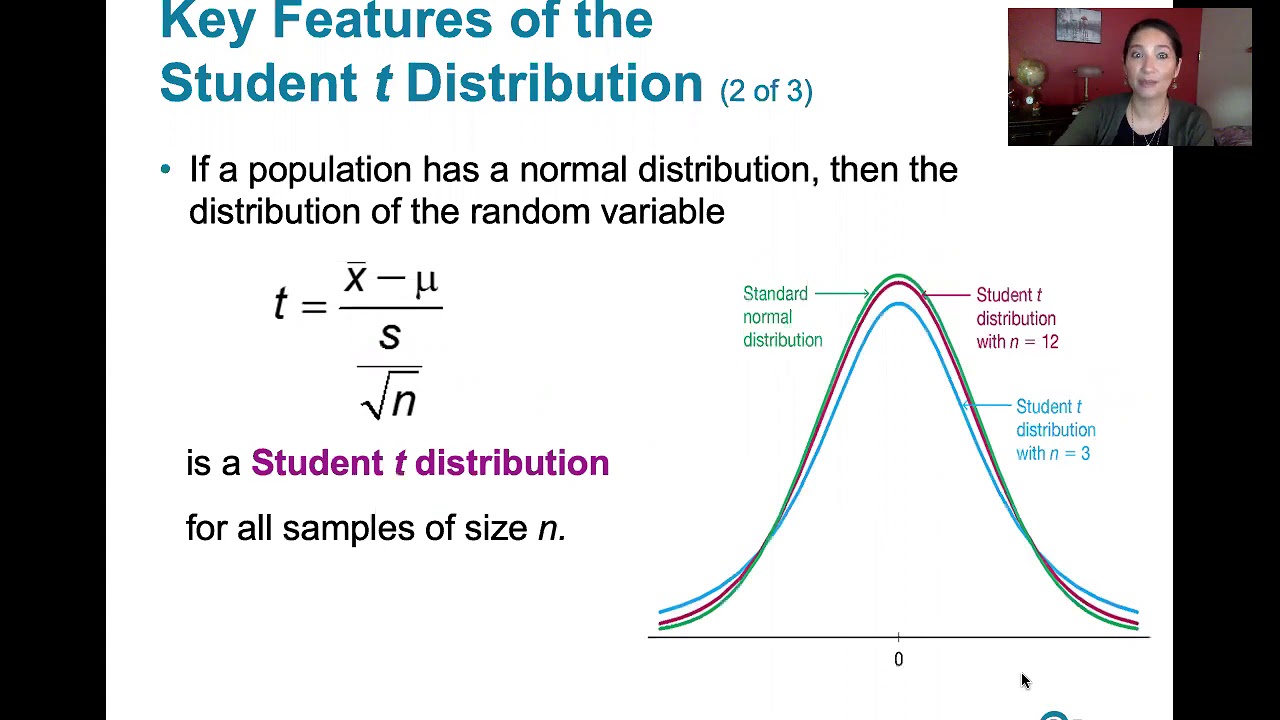
-The t statistic is calculated using the formula: (X bar - mu) / (s / sqrt(n)), where X bar is the sample mean, mu is the population mean, s is the sample standard deviation, and n is the sample size.
What are degrees of freedom in the context of the t distribution?
-Degrees of freedom in the context of the t distribution refer to the number of independent observations that contribute to estimating the variance. For the t distribution, the degrees of freedom are typically the sample size minus one (n-1).
How does the shape of the t distribution change with an increase in degrees of freedom?
-As the degrees of freedom increase, the t distribution tends to resemble the standard normal distribution more closely. It has lighter tails and a higher peak as it approaches the shape of the standard normal distribution.
What is the relationship between the t distribution and the standard normal distribution?
-The t distribution approaches the standard normal distribution as the degrees of freedom increase. At infinite degrees of freedom, the t distribution is identical to the standard normal distribution.
How does the t distribution differ from the standard normal distribution in terms of tails and peak?
-The t distribution has heavier tails and a lower peak compared to the standard normal distribution. This means that there is a higher probability of observing values that are far from the mean in the t distribution.
What is the significance of the t distribution in constructing confidence intervals when the population standard deviation is unknown?
-When the population standard deviation is unknown, using the t distribution to construct confidence intervals accounts for the additional uncertainty introduced by estimating the standard deviation from the sample. This results in a more accurate and wider interval that reflects the greater variability in the sample data.
Why is it incorrect to use the standard normal distribution (z-values) when the sample standard deviation is used in the calculation?
-Using z-values when the sample standard deviation is used can lead to an underestimation of the margin of error because the t distribution, which should be used in this case, has heavier tails and accounts for greater variability than the standard normal distribution.
What is the appropriate t value for a 95% confidence interval with five degrees of freedom?
-With five degrees of freedom, the appropriate t value for a 95% confidence interval is 2.571, which is larger than the z-value of 1.96 used for the standard normal distribution.
Is it ever appropriate to use the standard normal distribution instead of the t distribution, regardless of the sample size?
-It is not appropriate to use the standard normal distribution instead of the t distribution when the population standard deviation is unknown and the sample standard deviation is used, regardless of the sample size. The t distribution should be used to account for the variability introduced by estimating the standard deviation from the sample.
Outlines
📚 Introduction to the Student t Distribution
This paragraph introduces the concept of the Student t distribution, often just called the t distribution, which is used when estimating the population mean from a normally distributed population when the population standard deviation is unknown. The video script explains that instead of using the population standard deviation (sigma), we use the sample standard deviation (s) to estimate it. This leads to a new statistic, labeled as t, which has a t distribution with n-1 degrees of freedom. The paragraph also touches on the concept of degrees of freedom and how the t distribution resembles the standard normal distribution but with greater variability, as shown through a comparison of their respective plots. The t distribution's shape varies with degrees of freedom, and as these increase, the t distribution approaches the standard normal distribution.
📉 Comparing t Distribution and Standard Normal Distribution in Confidence Intervals
This paragraph delves into the practical application of the t distribution, particularly in constructing confidence intervals for the population mean when the population standard deviation is unknown. It contrasts the process of using the standard normal distribution (Z distribution) with that of the t distribution. The script explains that when sigma is known, the Z statistic and its corresponding value (z_.025 = 1.96) are used, but when sigma is unknown and replaced with the sample standard deviation, the t statistic and its corresponding t value from the t distribution must be used. The paragraph includes a table showing how the appropriate t value for a 95% confidence interval changes with different degrees of freedom, highlighting that even with large sample sizes, the t distribution should not be disregarded in favor of the standard normal distribution. The importance of using the correct distribution to avoid underestimating the margin of error is emphasized.
Mindmap
Keywords
💡Student t distribution
💡Random sample
💡Standard normal distribution
💡Population standard deviation (sigma)
💡Sample standard deviation (s)
💡Degrees of freedom
💡Confidence interval
💡Variance
💡T statistic
💡Normal distribution
💡Margin of error
Highlights
Introduction to the Student t distribution, often shortened to t distribution.
The video provides a light approach on mathematical details of the t distribution.
Explanation of the random sample of n observations from a normally distributed population.
Standard normal distribution of X bar minus mu over sigma over the square root of n.
Challenge of not knowing the population standard deviation sigma in practice.
Using sample standard deviation s to estimate unknown population standard deviation.
The statistic X bar minus mu over s over the square root of n follows a t distribution.
t distribution has n-1 degrees of freedom, linked to sample variance calculation.
Visual comparison between the standard normal distribution and t distribution.
t distribution's heavier tails and lower peak compared to the standard normal distribution.
t distribution's shape depends on degrees of freedom and approaches standard normal as degrees of freedom increase.
Demonstration of t distribution converging to standard normal distribution with increasing degrees of freedom.
Implications for statistical inference when constructing a 95% confidence interval.
Difference in using z value (1.96) from standard normal distribution vs. t value from t distribution.
Importance of using t distribution values for constructing confidence intervals when sigma is unknown.
Table of appropriate t values for various degrees of freedom and constructing confidence intervals.
Clarification that even with large sample sizes, t distribution should be used instead of standard normal distribution.
Emphasis on the correct use of t distribution over standard normal distribution regardless of sample size.
Transcripts
Browse More Related Video
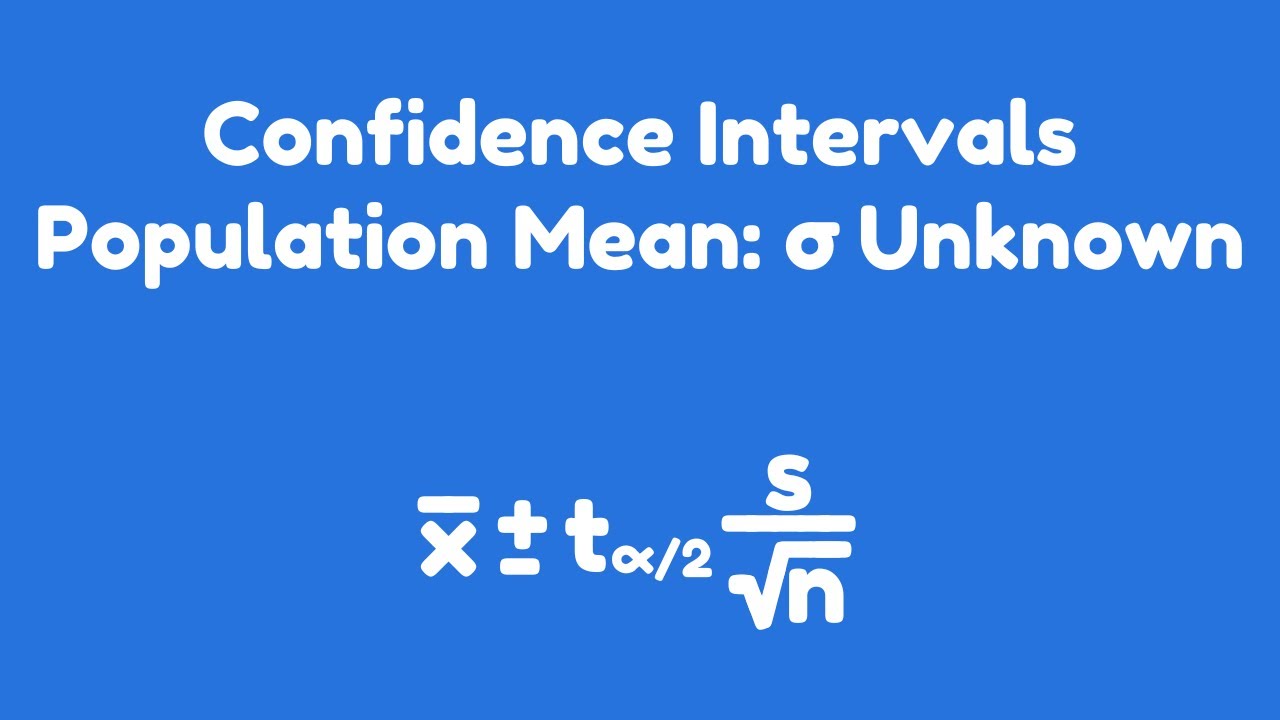
Confidence Intervals | Population Mean: σ Unknown
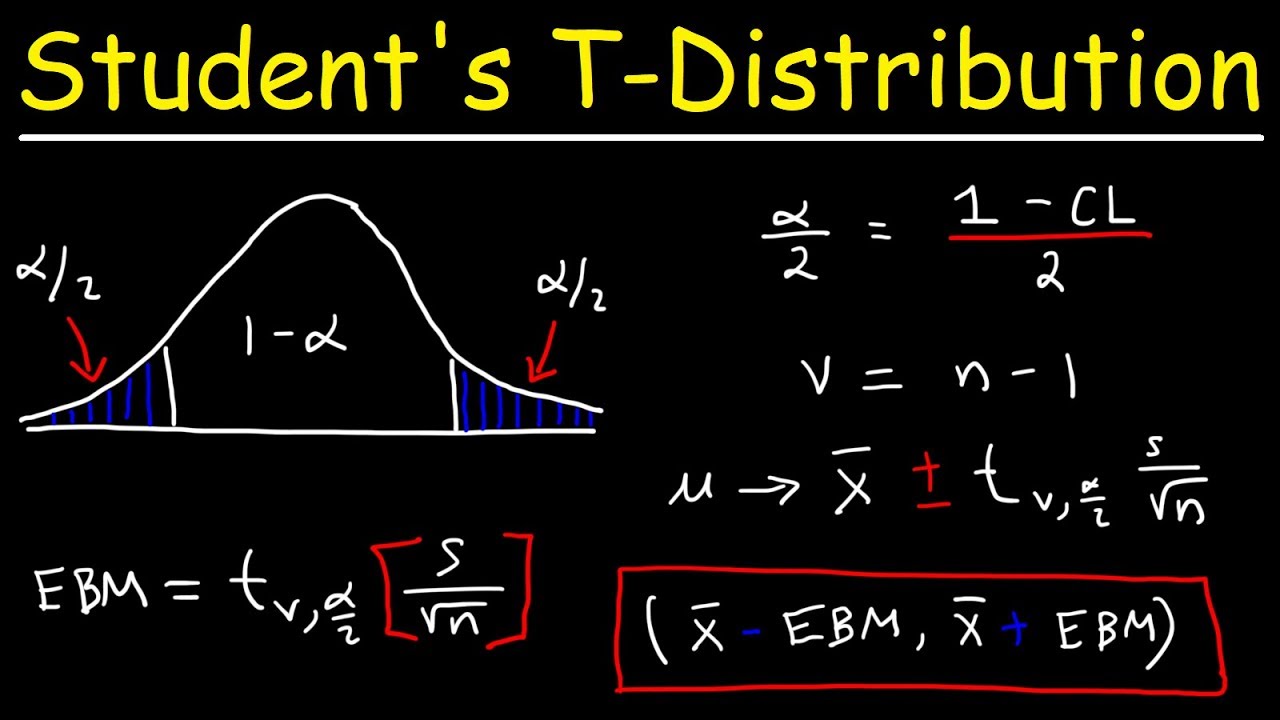
Student's T Distribution - Confidence Intervals & Margin of Error

Elementary Statistics - Chapter 7 - Estimating Parameters and Determining Sample Sizes Part 2
7.2.1 Estimating a Population Mean - Student t Distribution and Finding Critical t Values
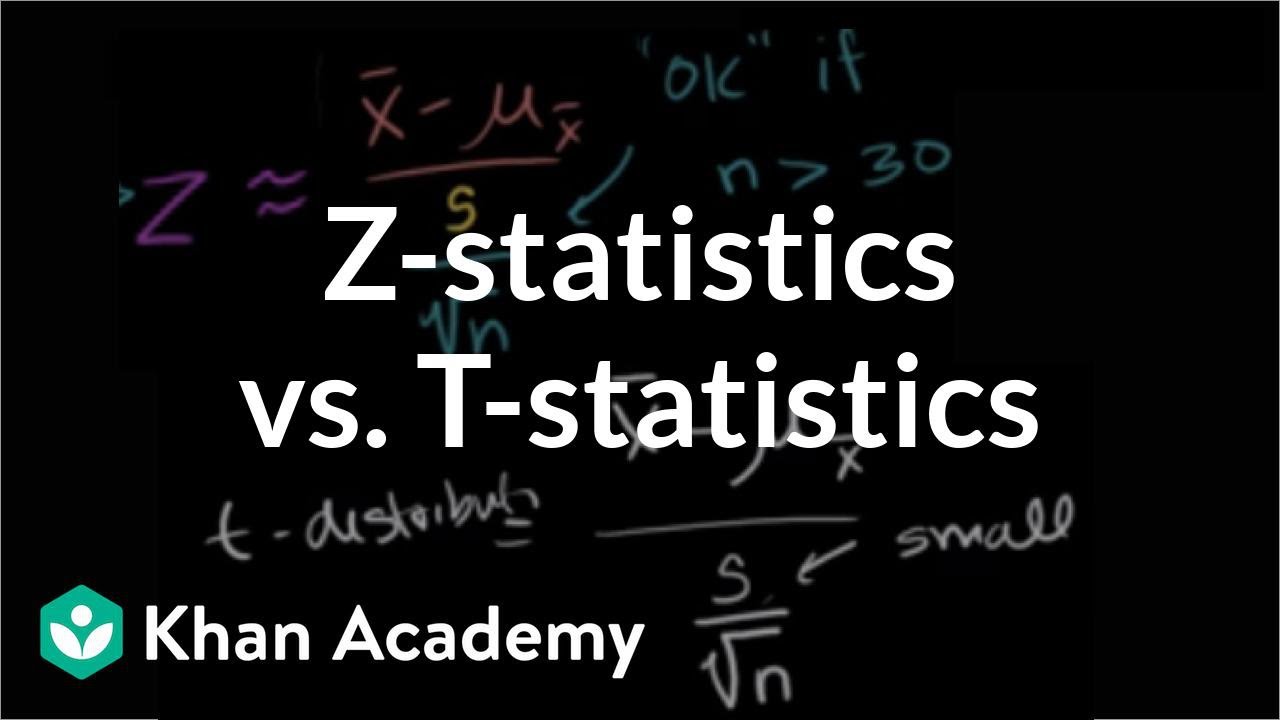
Z-statistics vs. T-statistics | Inferential statistics | Probability and Statistics | Khan Academy
Confidence Interval Concept Explained | Statistics Tutorial #7 | MarinStatsLectures
5.0 / 5 (0 votes)
Thanks for rating: