Confidence Intervals | Population Mean: σ Unknown
TLDRThis script discusses the concept of confidence intervals for estimating a population mean when the population standard deviation is unknown. It highlights the use of the t-distribution over the Z-distribution due to its adaptability with degrees of freedom, which increases as sample size grows and approaches the Z-distribution. The formula for calculating the confidence interval when the standard deviation is unknown is presented, along with a step-by-step example using a sample dataset to compute a 99% confidence interval, illustrating the process of finding the t-value and interpreting the resulting range as an estimate of the population mean.
Takeaways
- 📚 Confidence intervals are used to estimate the population mean when the population standard deviation is unknown.
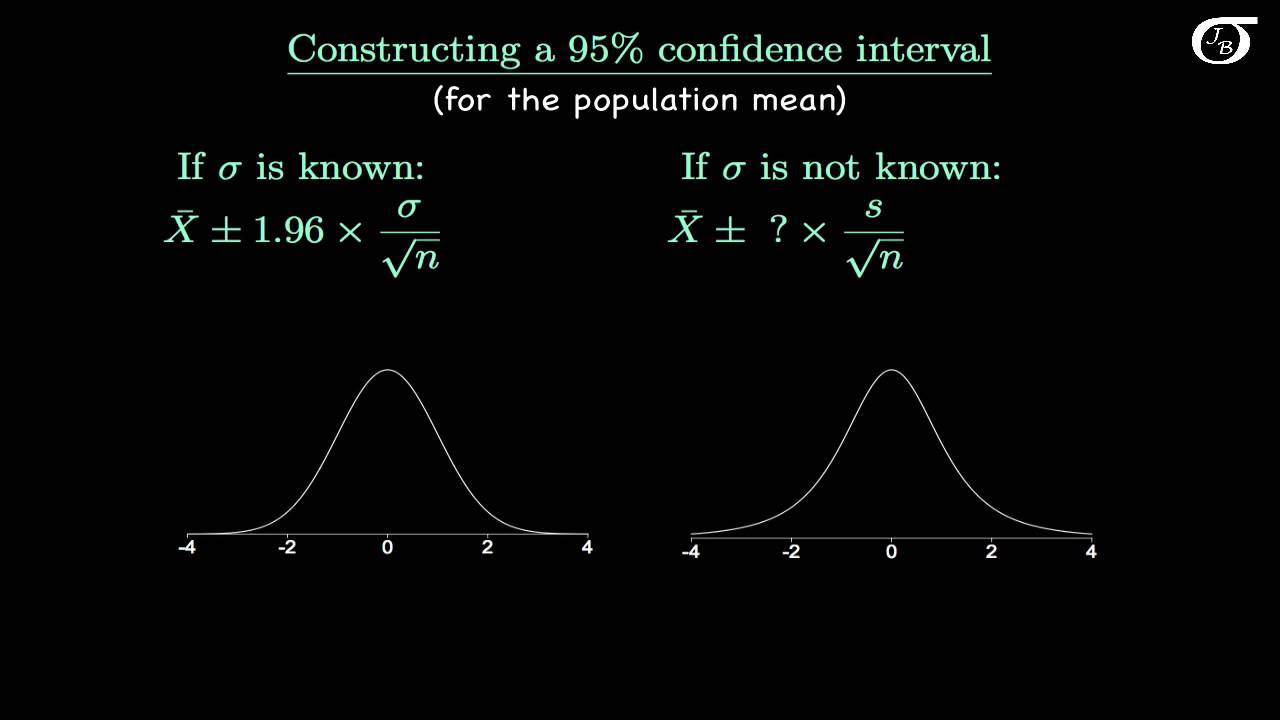
- 📉 The choice of probability distribution for constructing confidence intervals depends on whether the population standard deviation is known or unknown: Z-distribution for known, T-distribution for unknown.
- 🔄 The T-distribution is a family of distributions, each with a different number of degrees of freedom, and it approaches the Z-distribution as the degrees of freedom increase.
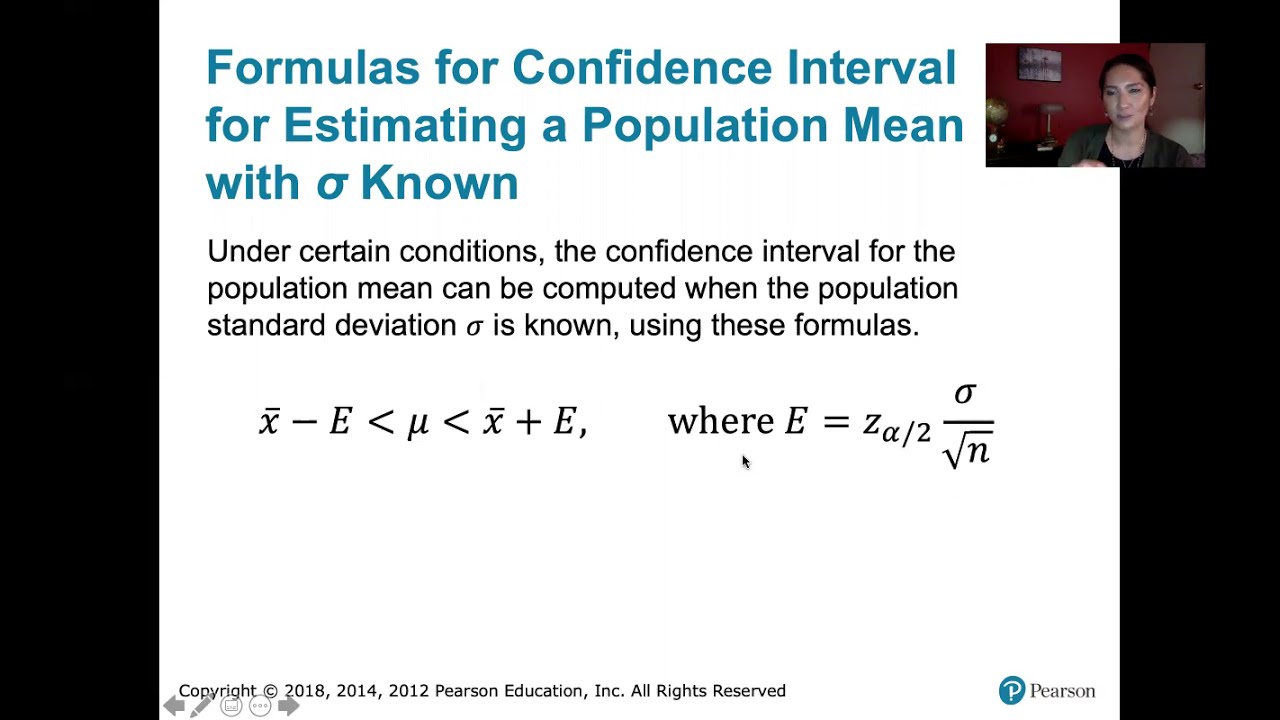
- 🔢 The formula for the confidence interval when the population standard deviation is known is \( \bar{X} \pm Z_{\alpha/2} \times \frac{\Sigma}{\sqrt{n}} \).
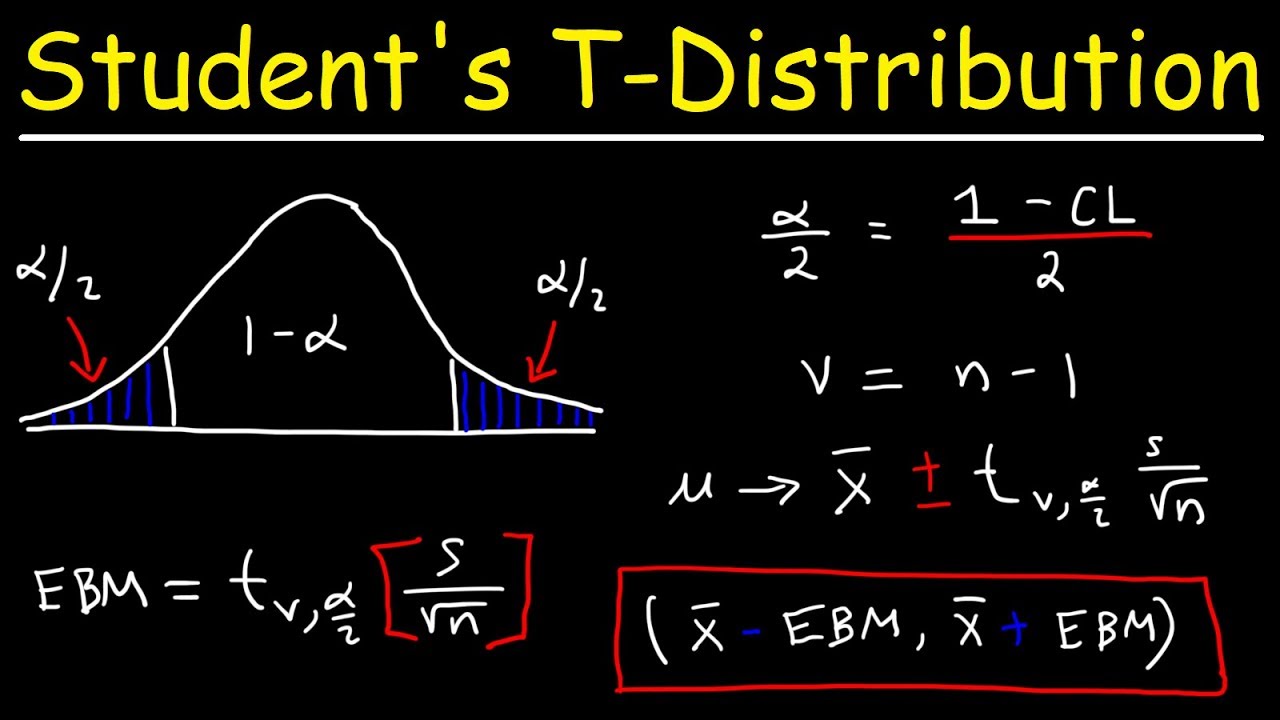
- 📐 When the population standard deviation is unknown, the formula changes to \( \bar{X} \pm T_{\alpha/2} \times \frac{S}{\sqrt{n}} \), where S is the sample standard deviation.
- 🔍 The T value, \( T_{\alpha/2} \), is found using the T-distribution table with the appropriate degrees of freedom and the desired confidence level.
- 📈 Degrees of freedom in the context of the T-distribution refer to the number of independent pieces of information in the sample, which is \( n - 1 \).
- 🧩 The sample standard deviation is calculated as the square root of the sum of the squared differences from the sample mean, divided by the degrees of freedom.
- 🔑 The confidence coefficient is the decimal form of the confidence level, for example, 0.95 for a 95% confidence level.
- 📝 To find \( T_{\alpha/2} \), set \( 1 - \alpha \) equal to the confidence coefficient and look up the corresponding T value in the T-distribution table for the given degrees of freedom.
- 📊 An example calculation of a 99% confidence interval for a population mean with an unknown standard deviation involves using the sample mean, sample standard deviation, and the appropriate T value from the T-distribution table.
Q & A
What are the two cases for calculating confidence intervals for a population mean?
-The two cases are when the population standard deviation (Sigma) is known and when it is unknown.
What is the main difference between using the Z distribution and the T distribution for confidence intervals?
-The Z distribution is used when the population standard deviation is known, while the T distribution is used when it is unknown. The T distribution is a family of distributions that depend on the degrees of freedom, unlike the Z distribution which is a single distribution.
How does the T distribution relate to the Z distribution as the degrees of freedom increase?
-As the degrees of freedom increase, the T distribution approaches the Z distribution. A T distribution with an infinite number of degrees of freedom is the same as the Z distribution.
What is the formula for the confidence interval when the population standard deviation is known?
-The formula is \( \bar{X} \pm Z_{\alpha/2} \times \frac{\Sigma}{\sqrt{n}} \), where \( \bar{X} \) is the sample mean, \( Z_{\alpha/2} \) is the Z value corresponding to the desired confidence level, \( \Sigma \) is the population standard deviation, and \( n \) is the sample size.
What changes are made to the formula for the confidence interval when the population standard deviation is unknown?
-When Sigma is unknown, Z is replaced with T (the T value from the T distribution), and Sigma is replaced with S (the sample standard deviation).
What is the formula for the confidence interval when the population standard deviation is unknown?
-The formula is \( \bar{X} \pm T_{\alpha/2} \times \frac{S}{\sqrt{n}} \), where \( T_{\alpha/2} \) is the T value corresponding to the desired confidence level and \( n-1 \) degrees of freedom.
How is the confidence coefficient related to the confidence level?
-The confidence coefficient is the decimal form of the confidence level. For example, a 95% confidence level corresponds to a confidence coefficient of 0.95.
What is the significance of degrees of freedom in the context of the T distribution?
-Degrees of freedom refers to the number of independent pieces of information that go into the calculation of the sample standard deviation, which is \( n-1 \) for a sample size \( n \).
How do you determine the T value (T Alpha half) for a confidence interval calculation?
-You find the T value that provides an area of alpha/2 in the upper tail of the T distribution with \( n-1 \) degrees of freedom, using a T distribution table.
Can you provide an example of calculating a 99% confidence interval for a population mean when the population standard deviation is unknown?
-Sure. Given a sample size of 54, a sample mean of 22.5, and a sample standard deviation of 4.4, you would first find the T value for a 99% confidence level and 53 degrees of freedom. Then, calculate the margin of error using the T value and plug it into the formula to find the confidence interval.
How do you interpret the result of a 99% confidence interval for the population mean?
-A 99% confidence interval means that you are 99% confident that the true population mean lies within the calculated interval.
Outlines
📊 Understanding Confidence Intervals for the Mean with Unknown Sigma
This paragraph introduces the concept of confidence intervals for estimating the population mean when the population standard deviation (Sigma) is unknown. It contrasts two scenarios: when Sigma is known and when it is not. The known Sigma scenario uses the Z-distribution, while the unknown Sigma scenario utilizes the T-distribution, which is a family of distributions depending on the degrees of freedom. As the degrees of freedom increase, the T-distribution approaches the Z-distribution. The formula for the confidence interval when Sigma is known is presented, and adjustments for the unknown Sigma case are explained, involving the use of the sample standard deviation (S) and the T-distribution.
🔢 Determining the T-Value for Confidence Intervals
The paragraph explains how to determine the T-value for constructing a confidence interval when the population standard deviation is unknown. It discusses the concept of the confidence coefficient, which is derived from the confidence level, and how to find the T-value that corresponds to the area in the upper tail of the T-distribution with n-1 degrees of freedom. The T-distribution table is highlighted as a useful tool for this purpose, as it provides the areas in the upper tail directly, unlike the Z-distribution table. The paragraph also delves into the concept of degrees of freedom, explaining its relation to the sample standard deviation and the number of independent pieces of information in the sample variance calculation.
📚 Calculating Degrees of Freedom and Sample Standard Deviation
This section further elaborates on the concept of degrees of freedom, emphasizing its importance in calculating the sample standard deviation. It explains that degrees of freedom is the number of independent data points used in the calculation, which is n-1 for a sample size of n, due to the inherent dependency among the data points when calculating the sum of (x - X̄) squared. The paragraph provides a clear rationale for why there are n-1 degrees of freedom, illustrating the dependency of the last data point on the others, and thus, its lack of independence in the calculation.
📐 Applying the Formula for Confidence Intervals with an Example
The paragraph presents a practical example of calculating a 99% confidence interval for a population mean when the population standard deviation is unknown. It outlines the steps to determine the confidence coefficient, calculate the T-value for the given degrees of freedom and confidence level, and apply the formula for the confidence interval. Using a sample size of 54, a sample mean of 22.5, and a sample standard deviation of 4.4, the paragraph guides through the process of finding the T-value from the T-distribution table and then using it to calculate the margin of error and the confidence interval range. The result is interpreted to express a 99% confidence that the true population mean lies between the calculated interval bounds.
Mindmap
Keywords
💡Confidence Interval
💡Population Standard Deviation (Sigma)
💡Z Distribution
💡T Distribution
💡Degrees of Freedom
💡Sample Standard Deviation (S)
💡Sample Mean (X bar)
💡Confidence Level
💡Confidence Coefficient
💡Margin of Error
💡Sample Size (n)
Highlights
Introduction to confidence intervals for the population mean when the population standard deviation is unknown.
Difference in probability distributions used when the population standard deviation is known (Z-distribution) and unknown (T-distribution).
Explanation of the T-distribution as a family of probability distributions with varying degrees of freedom.
Clarification that the T-distribution approaches the Z-distribution as the degrees of freedom increase.
Formula for the confidence interval when the population standard deviation is known.
Modification of the formula for the case when the population standard deviation is unknown, using T instead of Z and sample standard deviation S.
Process of finding T Alpha half by setting 1 minus Alpha equal to the confidence coefficient.
Use of the T-distribution table to find the T value for a given upper tail area and degrees of freedom.
Explanation of degrees of freedom in the context of calculating the sample standard deviation.
Understanding that degrees of freedom is the number of independent pieces of information in the sample standard deviation calculation.
Example calculation of a 99% confidence interval for the population mean with an unknown standard deviation.
Step-by-step calculation using the sample size, mean, standard deviation, and desired confidence level.
Identification of the margin of error in the calculated confidence interval.
Interpretation of the confidence interval result, indicating the level of confidence that the true population mean lies within the interval.
Emphasis on the practical application of confidence intervals in statistical analysis.
Importance of selecting the correct T value from the T-distribution table based on degrees of freedom and desired confidence level.
Summary of the key steps involved in calculating a confidence interval for the population mean when the standard deviation is unknown.
Transcripts
Browse More Related Video
Introduction to the t Distribution (non-technical)
7.2.5 Estimating a Population Mean - Confidence Intervals with Known Pop. Standard Deviation
Student's T Distribution - Confidence Intervals & Margin of Error

Elementary Statistics - Chapter 7 - Estimating Parameters and Determining Sample Sizes Part 2
Confidence Interval Concept Explained | Statistics Tutorial #7 | MarinStatsLectures
2610 Chapter 8 Day 1
5.0 / 5 (0 votes)
Thanks for rating: