Samples from a Normal Distribution | Statistics Tutorial #4 | MarinStatsLectures
TLDRThis video delves into the behavior of samples and their role in statistical analysis, emphasizing the importance of understanding how samples may differ from the population they represent. Through simulations using R software and web visualization tools, the video demonstrates how samples of varying sizes drawn from a normal distribution can yield different means and standard deviations, highlighting the variability inherent in sampling. It encourages viewers to experiment with different sample sizes to gain a more intuitive grasp of sampling variability and its impact on statistical inference.
Takeaways
- 📊 Understanding sample behavior is crucial for making generalizations about a population.
- 🔢 Samples may not always perfectly represent the population they are drawn from due to natural variability.
- 🌟 The video uses a normal distribution with a mean of 150 and a standard deviation of 40 as an example.
- 📈 R software is utilized to simulate drawing samples and visualizing their distribution.
- 📝 Histograms of sample data can be misleading, even if they come from a perfectly normal population distribution.
- 🎯 The sample mean and standard deviation can differ from the population's true values.
- 🔄 Repeated sampling demonstrates the variability in sample statistics.
- 🔢 Increasing sample size tends to produce sample statistics that are closer to the population parameters.
- 🌐 A web visualization tool is introduced as an alternative to R for understanding sample behavior.
- 📊 The video emphasizes the importance of not just the sample data but also the sample size in statistical analysis.
- 📚 The concept of statistical inference is introduced as the process of making statements about a population based on sample data.
Q & A
What is the main focus of the video?
-The main focus of the video is to understand how samples behave and how they can be used to make generalizations about a population in the context of statistical analysis.
Why is it important to learn about sample behavior in statistics?
-It is important because the behavior of samples helps us make accurate statistical inferences about populations, which is a fundamental aspect of statistical analysis.
What is the example distribution used in the video?
-The example distribution used in the video is a normal distribution with a mean of 150 and a standard deviation of 40.
How does the video demonstrate the behavior of samples?
-The video demonstrates the behavior of samples by using R software to draw samples from a known normal distribution and then analyzing the sample means and standard deviations to see how they compare to the population parameters.
What is the significance of the sample size in the context of the video?
-The sample size is significant because it affects the variability of sample statistics and their closeness to the population parameters. Larger sample sizes tend to produce sample means and standard deviations that are closer to the population values.
What did the video show when different sample sizes were drawn from the normal distribution?
-The video showed that as the sample size increased, the sample means and standard deviations became more consistent with the population parameters, and the histograms started to resemble the normal distribution more closely.
How does the video address the misconception about the appearance of sample histograms?
-The video addresses the misconception by showing that even though the histograms of smaller samples may not appear perfectly normal, they are still drawn from a normally distributed population. This serves as a reminder that sample statistics can vary from the population parameters, especially with smaller sample sizes.
What tool does the video suggest using for further exploration of sample behavior?
-The video suggests using a web visualization tool for further exploration of sample behavior, allowing viewers to manipulate sample sizes and observe the effects on sample statistics.
What can be concluded from the video's simulations and visualizations?
-The simulations and visualizations demonstrate that while samples may vary from the population parameters, especially in terms of sample size and distribution appearance, increasing the sample size can lead to more accurate representations of the population.
Where can viewers find the R script and web visualization link used in the video?
-Viewers can find the R script and web visualization link in the video description below the video.
What is the ultimate goal of understanding sample behavior in statistics?
-The ultimate goal is to be able to make accurate statistical inferences about populations using sample data, which is crucial for hypothesis testing, estimation, and other statistical analyses.
Outlines
📊 Understanding Sample Behavior in Statistics
This paragraph introduces the concept of sample behavior in statistical analysis. It emphasizes the importance of understanding how a sample may differ from the population it represents. The speaker uses the example of drawing samples from a normal distribution with known parameters (mean of 150 and standard deviation of 40) to illustrate how sample statistics like mean and standard deviation can vary. The paragraph discusses the use of statistical software R for simulations and web visualization tools to demonstrate these concepts. It highlights the idea that even though samples may not always appear to be from the original distribution, they are drawn from a perfectly normal population in the simulation. The speaker encourages viewers to experiment with different sample sizes to gain a better understanding of sample variability.
🔬 Exploring Sample Variation Through Simulation and Visualization
The second paragraph continues the discussion on sample variation by suggesting further exploration through simulation and visualization. The speaker invites the audience to form a more precise understanding of how samples deviate from population values through mathematical formalization. The paragraph concludes with an encouragement to engage with the provided R script and web visualization tool for an intuitive grasp of the topic. The speaker also prompts viewers to subscribe to Marinstatslectures for more content, indicating that additional resources are available for those interested in deepening their understanding of statistical concepts.
Mindmap
Keywords
💡samples
💡population
💡statistical inference
💡normal distribution
💡mean
💡standard deviation
💡histogram
💡simulation
💡sample size
💡R (Software)
💡web visualization tool
💡sampling variability
Highlights
The video discusses the behavior of samples and their importance in statistical analysis.
It emphasizes the need to understand how a sample may differ from the population it represents.
The video uses a normal distribution with a known mean and standard deviation as an example.
R (Statistical Software) is used to simulate drawing samples from the normal distribution.
Histograms are generated to visualize the distribution of sample data.
The video demonstrates that sample means and standard deviations may vary, even when drawn from a known population.
The concept of statistical inference is introduced as making statements about a population based on sample data.
The video shows that a small sample size of 20 can lead to varying results in terms of mean and standard deviation.
Increasing the sample size to 50 results in more consistent estimates of the population parameters.
The video illustrates that even large sample sizes may not perfectly represent the population distribution.
Web visualization tools are mentioned as an alternative to R for understanding sample behavior.
The video encourages viewers to experiment with different sample sizes to gain a better understanding of sampling variability.
The video concludes by suggesting that formal mathematical understanding will be developed in future content.
R scripts and web visualization links are provided in the video description for further exploration.
The video is part of a series on statistical analysis, suggesting a comprehensive approach to the topic.
The importance of understanding sampling distribution is emphasized for accurate statistical inference.
Transcripts
Browse More Related Video
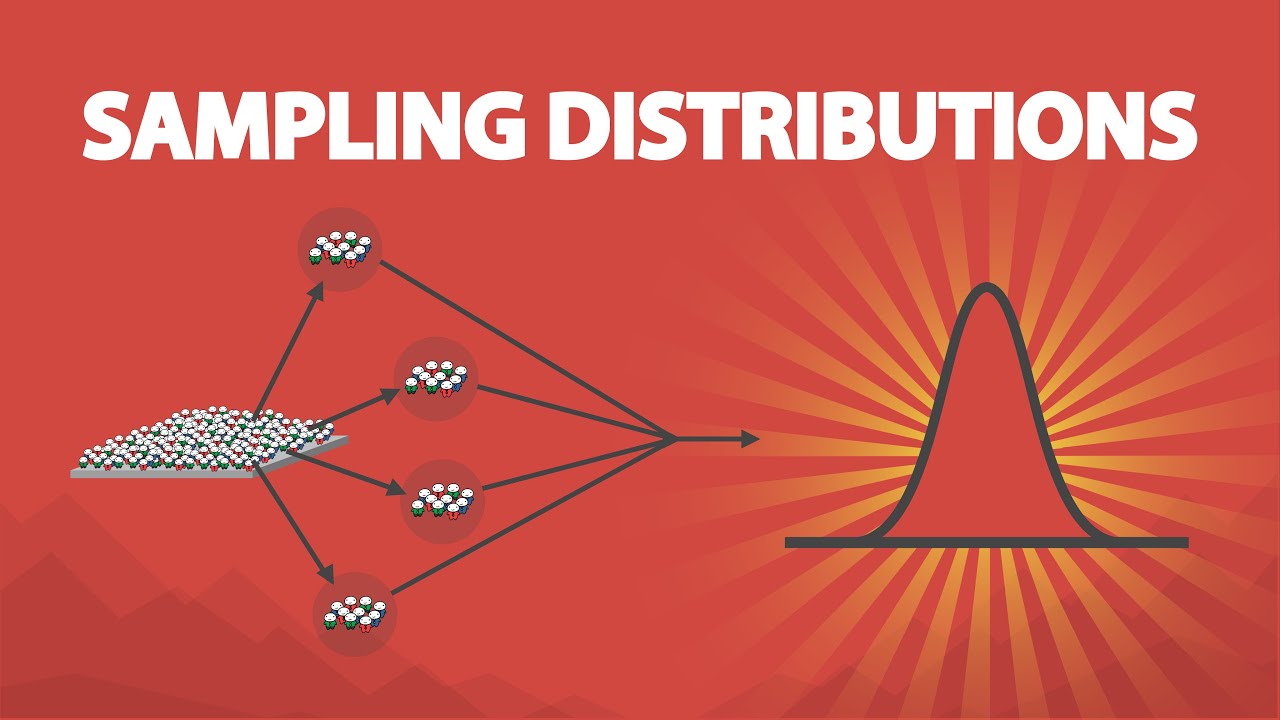
Sampling Distributions: Introduction to the Concept
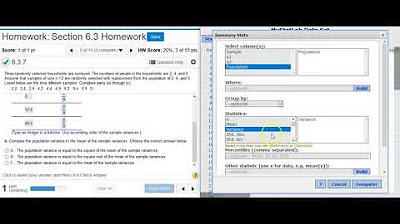
[6.3.7] Creating a variance sampling distribution probability distribution table in StatCrunch
population sample parameter statistic | Gourav Manjrekar
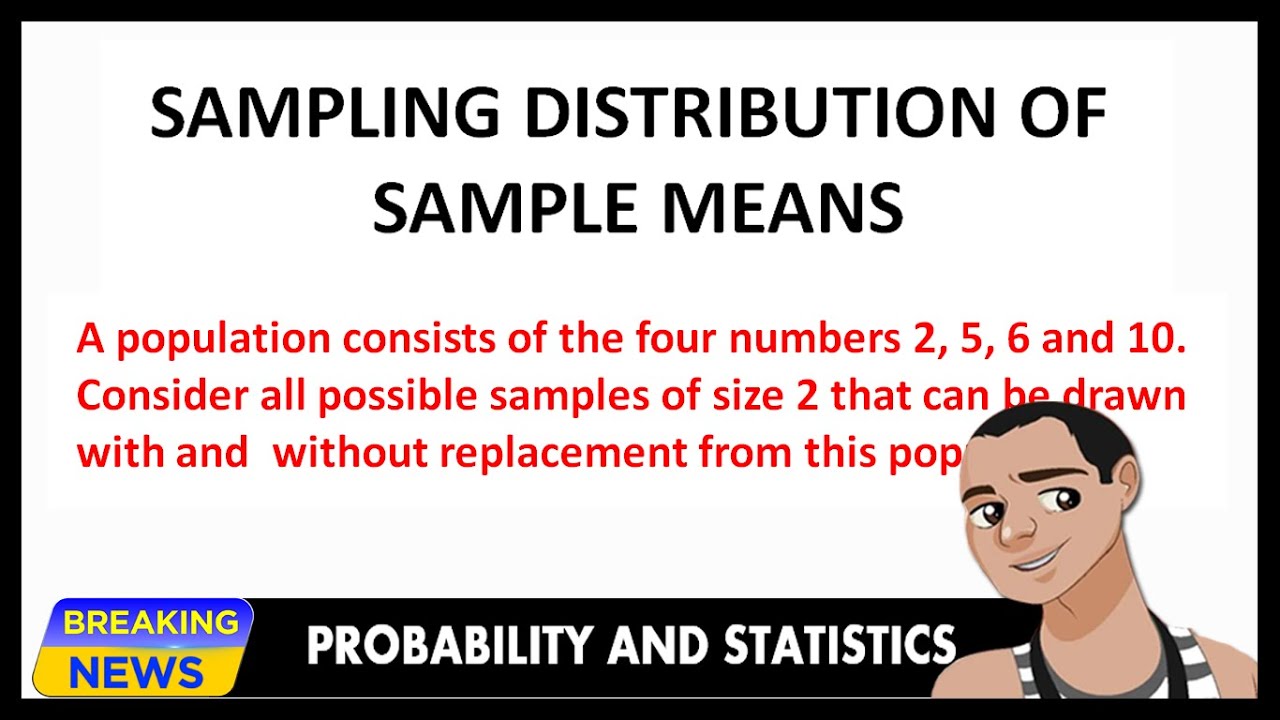
SAMPLING DISTRIBUTION OF SAMPLE MEANS - WITH AND WITHOUT REPLACEMENT

01 - Sampling Distributions - Learn Statistical Sampling (Statistics Course)
Sampling Distributions (7.2)
5.0 / 5 (0 votes)
Thanks for rating: