01 - Sampling Distributions - Learn Statistical Sampling (Statistics Course)
TLDRThis lesson introduces the fundamental concepts of statistics, emphasizing the importance of understanding the population and the sample. It explains how by taking multiple samples from a population and calculating their means, we create a sampling distribution. The lesson also touches on different types of distributions, such as normal, skewed, and uniform, and their relevance to understanding the population. The concept of sample size and the calculation of sample means are highlighted as crucial elements in statistical analysis.
Takeaways
- 📚 The fundamental purpose of statistics is to understand and draw conclusions about a large population by studying smaller samples.
- 🔍 A population refers to the entire group that we wish to study, which is typically too large to examine individually.
- 📈 Sampling involves selecting a smaller group (sample) from the larger population to study and gather information.
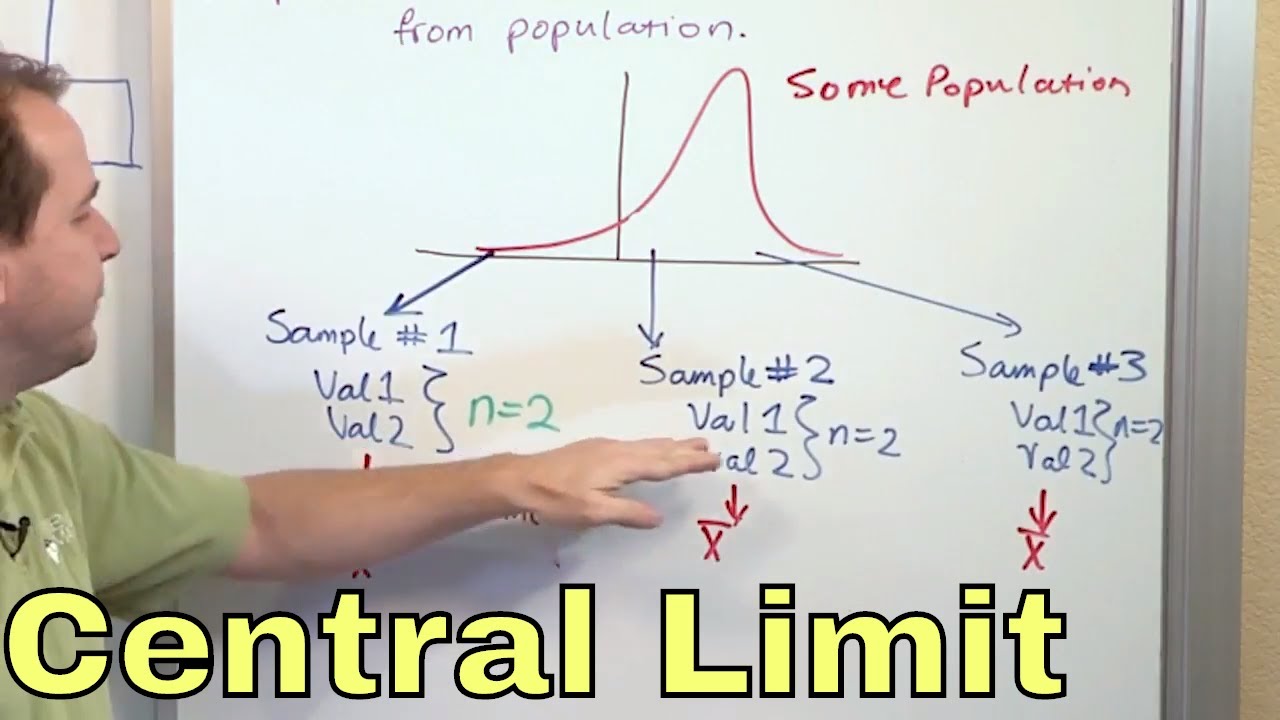
- 📊 The sampling distribution is the distribution of results (like means or standard deviations) obtained from multiple samples of a population.
- 🥄 The concept of sampling is akin to taking a sip from a cup of coffee to infer the sweetness of the entire drink; it's an estimation based on a small portion.
- 🌟 Different types of distributions can emerge from sampling, with the normal distribution (bell curve) being the most common.
- 📉 Skewed distributions occur when the data is not symmetrical, often due to specific characteristics of the population being studied.
- 🔢 When sampling, one can calculate various statistical measures for each sample, such as the mean and standard deviation.
- 🔄 The process of repeatedly calculating and collecting these statistical measures across multiple samples contributes to the sampling distribution.
- 📊 A sampling distribution of sample means specifically refers to the distribution of the average values obtained from various samples.
- 📚 The central limit theorem, to be covered in the next section, will explain the significance and application of the sampling distribution of sample means.
Q & A
What is the primary purpose of statistics?
-The primary purpose of statistics is to draw conclusions and learn about a large population by studying a smaller sample of that population.
Why is it impractical to survey an entire population?
-It is impractical to survey an entire population because of the large number of individuals involved, making it impossible to study each person individually, such as all adults in North America.
What is a population in the context of statistics?
-A population in statistics is the entire, large collection of individuals or items that we are trying to study, but we can only study them indirectly due to their large numbers.
What is a sample in statistics?
-A sample in statistics is a smaller subset of the population that is selected for study. For example, if studying all adults in North America, a sample might be 35 randomly chosen individuals.
How does the concept of a sampling distribution relate to the study of a population?
-A sampling distribution relates to the study of a population by representing the distribution of sample means (or other statistics) taken from that population. It helps us understand what conclusions we can draw from a sample about the larger population.
What are some limitations of using a sample to make conclusions about a population?
-Limitations include the fact that the sample may not be representative of the entire population, and the conclusions drawn from the sample may not perfectly match the characteristics of the larger population due to variations within the sample.
What is a normal distribution in statistics?
-A normal distribution, also known as the bell curve, is a type of distribution in which the probabilities of outcomes cluster around an average or mean value, with fewer outcomes occurring as you move further away from the mean.
What is a skewed distribution?
-A skewed distribution is one that is not symmetrical. It can be skewed to the left or right, indicating that the tail of the distribution extends more in one direction than the other, such as with IQ scores of students from a top university.
What is the central limit theorem and why is it significant?
-The central limit theorem is a statistical theory stating that the distribution of sample means approaches a normal distribution, regardless of the original distribution of the population, as long as the sample size is sufficiently large. This is significant because it allows us to make inferences about the population from our sample means.
How is the sample size determined in a study?
-The sample size is determined based on the desired level of accuracy, the variability in the population, and practical considerations such as time and resources. It's the number of individuals or observations included in each sample.
What are some common statistical measures calculated for a sample?
-Common statistical measures calculated for a sample include the mean (average), variance, and standard deviation. These measures help describe the central tendency and spread of the data within the sample.
What is the difference between a sample and a population in terms of distribution?
-A population distribution describes the entire set of outcomes for the variable of interest within the whole population, while a sample distribution describes the variation in outcomes for the same variable across multiple samples taken from that population.
Outlines
📚 Introduction to Statistics and Sampling
This paragraph introduces the fundamental concepts of statistics, emphasizing the importance of understanding large populations through smaller samples. The host, Jason, explains that statistics aim to draw conclusions about a whole group by studying a subset of data. He highlights the necessity of grasping basic statistical concepts like the normal probability distribution to build a solid foundation for more complex topics. The discussion sets the stage for exploring the sampling distribution in subsequent lessons.
🔍 Understanding Sampling Distributions
In this paragraph, the focus shifts to the concept of sampling distributions. The host uses the analogy of sampling coffee to explain how a small sample can represent a larger population. He discusses the variability in samples and how they may differ from one another, yet still provide insights into the population. The paragraph delves into the idea that even with regional variations and different backgrounds, sampling allows us to make inferences about a larger group. It establishes the groundwork for understanding how sample means and their distribution can inform us about the population's characteristics.
📈 Types of Distributions and Their Characteristics
This paragraph introduces different types of distributions, such as normal, skewed, and uniform, to help understand the potential shapes of a sampling distribution. The host explains that while the normal distribution is symmetrical and common in many natural and human-related phenomena, skewed distributions occur when there's a bias towards one end, as seen in the IQs of students from top universities. The uniform distribution, although less common, represents an equal chance of any value occurring. These distribution types are crucial for interpreting the results of statistical analyses and understanding the population's underlying structure.
📊 Collecting Data and Calculating Sample Statistics
The host discusses the process of data collection and the calculation of sample statistics, such as the mean, variance, and standard deviation. He emphasizes the importance of understanding sample size, which refers to the number of data points collected at one time. The paragraph clarifies that while we may collect data multiple times, the sample size refers to the number of individuals or items in each individual collection. By calculating statistics for each sample and organizing them, we can form a sampling distribution, which is a crucial step in statistical analysis.
🌟 The Concept of Sampling Distribution of Sample Means
This paragraph zeroes in on the concept of the sampling distribution of sample means, which is the collection of means from numerous samples drawn from a population. The host illustrates this by imagining a scenario where the number of siblings of individuals is surveyed. He explains that by repeatedly calculating the mean number of siblings for different samples, we can create a sampling distribution of these means. This distribution is vital for statistical inference, as it allows us to understand the central tendency and variability of sample means within a population. The paragraph concludes by noting that the next section will explore the central limit theorem, which will provide further insight into the utility of sampling distributions.
Mindmap
Keywords
💡Statistics
💡Population
💡Sample
💡Sampling Distribution
💡Mean
💡Variance
💡Standard Deviation
💡Skewed Distribution
💡Normal Distribution
💡Central Limit Theorem
💡Sample Size
Highlights
The fundamental purpose of statistics is to understand large populations by studying smaller samples.
Statistics involves drawing conclusions about a population based on a sample, which has its limitations.
A population is the entire group that we want to study, but we often cannot survey every individual.
A sample is a smaller group taken from the population for the purpose of study.
The sampling distribution is the result of taking multiple samples from a population and analyzing the data collected.
The concept of sampling is crucial in statistics as it allows us to make inferences about the larger population.
Different samples taken from the same population will yield different results, which is a natural part of the sampling process.
The central limit theorem is a key statistical concept that will be explored in the next section.
Normal distribution, also known as the bell curve, is a common type of distribution found in many natural and man-made phenomena.
Skewed distribution occurs when the data is not symmetrical, often due to specific characteristics of the population being studied.
Uniform distribution is a theoretical concept where every point has an equal chance of occurring.
When sampling, the sample size refers to the number of data points collected in one unit for analysis.
For each sample collected, we can calculate various statistical measures such as the mean, variance, and standard deviation.
The sampling distribution of sample means is the collection of all sample means obtained from multiple samples.
Understanding the terminology and concepts of sampling distributions is crucial for applying statistical methods correctly.
The central limit theorem will be discussed in the next section, which will explain the practical applications of sampling distributions.
The lecture emphasizes the importance of understanding definitions and concepts in statistics to solve problems effectively.
The sampling process and the resulting distribution provide a way to estimate population parameters based on sample data.
The lecture introduces the idea that sampling can lead to variations, which are essential in understanding the population's characteristics.
Transcripts
Browse More Related Video
02 - What is the Central Limit Theorem in Statistics? - Part 1
Sampling Distributions: Introduction to the Concept
Top 10 Tips for AP Statistics Unit 5 Sampling Distributions

WHAT IS A "SAMPLING DISTRIBUTION" and how is it different from a "sample distribution"... and stuff
6.3.0 Sampling Distributions and Estimators - Lesson Overview, Learning Outcomes and Key Concepts

Sampling distribution of the sample mean | Probability and Statistics | Khan Academy
5.0 / 5 (0 votes)
Thanks for rating: