[6.3.7] Creating a variance sampling distribution probability distribution table in StatCrunch
TLDRIn this instructional video, Professor Curtis from Aspire Mountain Academy guides viewers through creating a variance sampling distribution probability table using a hypothetical survey of household sizes. He demonstrates how to calculate the variance for nine different samples in StatCrunch and how to summarize these variances into a probability distribution table. The video also covers comparing the sample variances to the population variance, emphasizing that variance is an unbiased estimator, and concludes with tips on memorizing biased and unbiased estimators for statistical analysis.
Takeaways
- 📚 The video is a statistics homework help tutorial by Professor Curtis from Aspire Mountain Academy.
- 🔍 The main topic is creating a variance sampling distribution and probability distribution table for a given problem.
- 👨🏫 Professor Curtis guides viewers through the process step-by-step to alleviate initial confusion about the task.
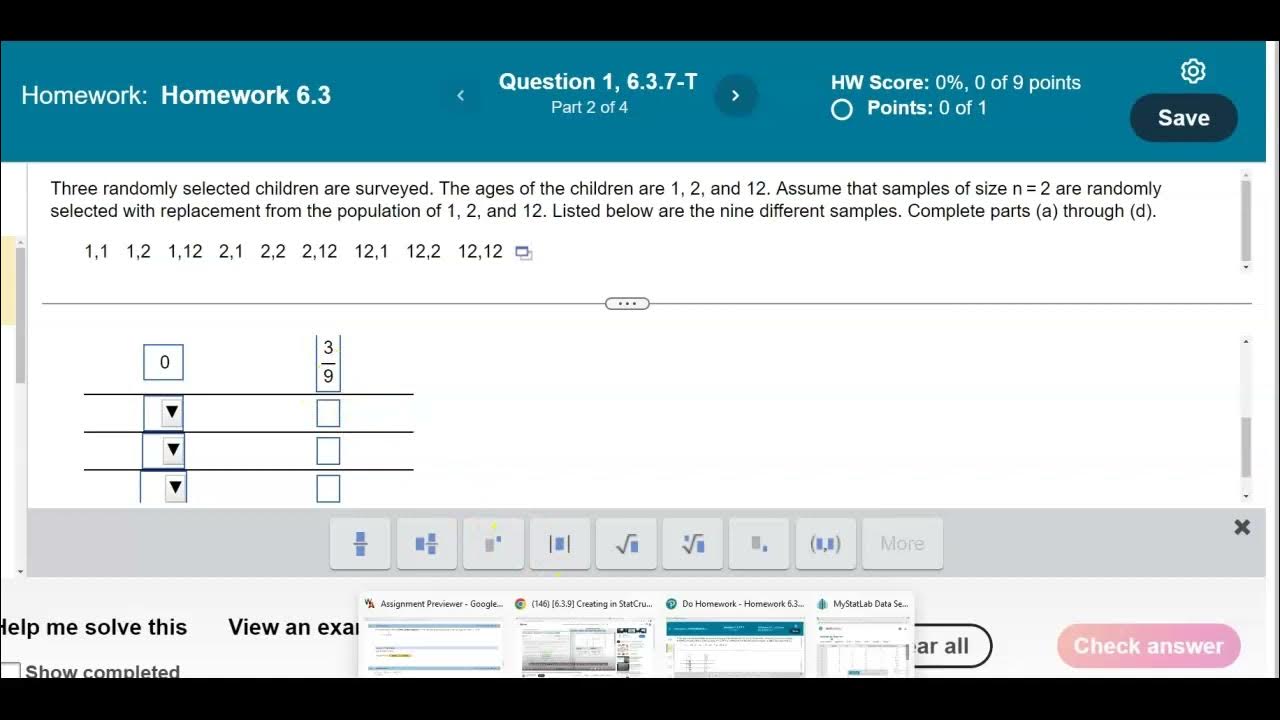
- 📝 The problem involves surveying three households with 2, 4, and 9 people, respectively, and analyzing the variance of nine different samples.
- 📊 The tutorial demonstrates how to use StatCrunch software to calculate the variance for each sample and create a summary table.
- 🔢 The variance values are ordered and summarized in a table to represent the probability distribution of distinct values.
- 🎯 Probabilities are calculated by dividing the frequency of each variance value by the total number of samples.
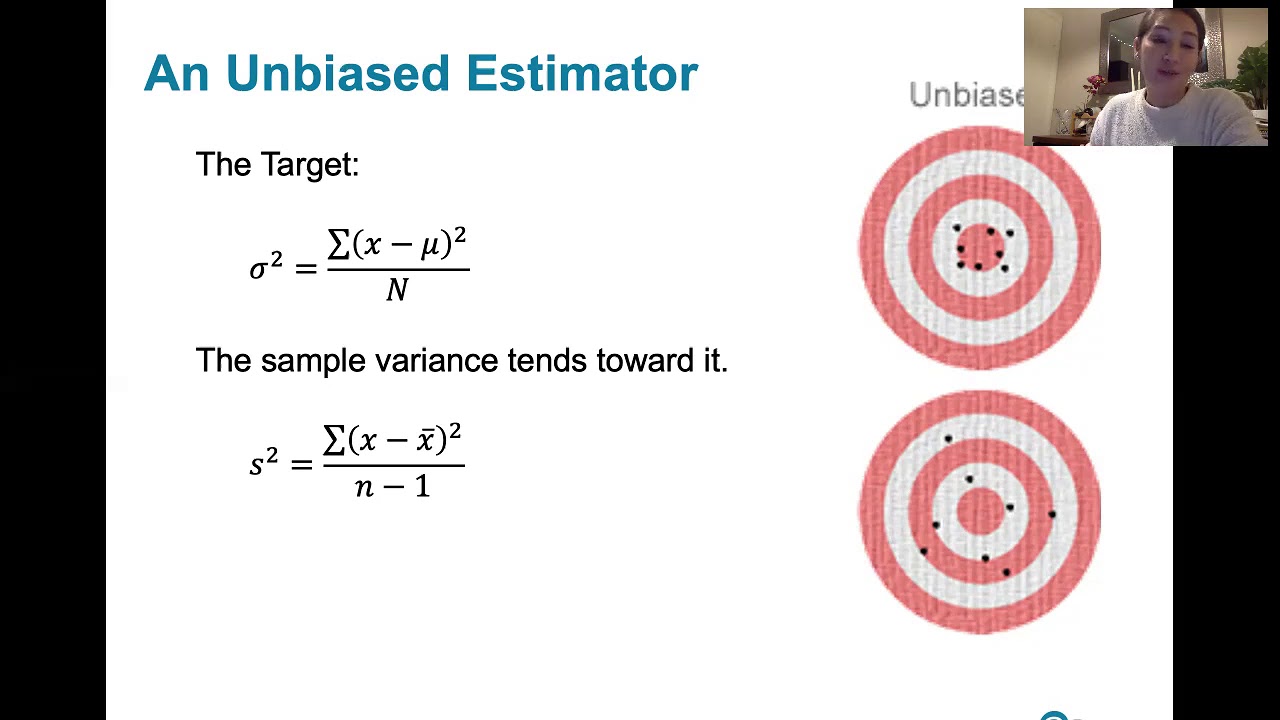
- 📈 The population variance is compared to the mean of the sample variances to understand the concept of biased and unbiased estimators.
- ⚖️ Variance is identified as an unbiased estimator, meaning the mean of the sample variances should align with the population variance.
- 📉 The video addresses potential discrepancies due to small sample sizes and emphasizes the importance of understanding estimator bias.
- 📚 The tutorial concludes with an invitation for feedback and an offer to access more learning resources on Aspire Mountain Academy's website.
Q & A
What is the main topic of the video?
-The main topic of the video is how to create a variance sampling distribution probability distribution table using a statistical software called StatCrunch.
What is the problem statement given in the video?
-The problem statement involves three randomly selected households with 2, 4, and 9 people in them, and the task is to find the variance of each of the nine possible samples of size n=2 selected with replacement from this population.
What is the first step in solving the problem according to the video?
-The first step is to find the variance for each of the nine samples using the statistical software StatCrunch.
Why does Professor Curtis prefer to use Excel for this type of problem?
-Professor Curtis prefers Excel because it is a familiar tool for him, but in this video, he demonstrates the process in StatCrunch due to student requests.
How does the video guide viewers to input data into StatCrunch?
-The video guides viewers to input data by showing how to enter the data into StatCrunch, resize the window for better visibility, and select the appropriate options for calculating variance.
What is the method used in the video to summarize the variances in a table?
-The method involves ordering the variance values from lowest to highest using the sorting function in StatCrunch and then creating a table with the distinct variance values and their corresponding probabilities.
How are the probabilities for each variance value calculated in the video?
-The probabilities are calculated by dividing the number of occurrences of each variance value by the total number of samples, which is nine in this case.
What is the purpose of Part B in the video?
-Part B of the video asks viewers to compare the population variance to the mean of the sample variances and choose the correct answer based on whether the sample variances are an unbiased estimator of the population variance.
How does the video handle the comparison between population variance and sample variances?
-The video demonstrates how to calculate the population variance in StatCrunch and then compares it to the mean of the sample variances, noting that variance is an unbiased estimator and should target the population variance.
What is the key takeaway from Part C of the video?
-The key takeaway from Part C is that sample variances should target the value of the population variance, reinforcing the concept that variance is an unbiased estimator.
How does the video conclude and what additional resources does it offer?
-The video concludes by summarizing the steps taken and encouraging viewers to leave comments for feedback. It also offers additional resources by directing viewers to Aspire Mountain Academy's website for more lecture videos and statistical help.
Outlines
📚 Introduction to Variance Sampling Distribution
Professor Curtis from Aspire Mountain Academy introduces a statistics homework help video, focusing on creating a variance sampling distribution and probability distribution table. The problem involves surveying three households with varying numbers of people and calculating the variance for nine different samples of size n=2 with replacement. The video aims to guide students step by step through the process of finding the variance for each sample, summarizing the sampling distribution of variances in a table, and understanding the concept without being overwhelmed by the complexity of the task. The professor prefers using Excel but demonstrates the process in StatCrunch, emphasizing the importance of methodical problem-solving.
📉 Comparing Population Variance to Sample Variances
This section of the video script discusses how to compare the population variance to the mean of the sample variances. The population variance is calculated using the given population values (2, 4, and 9) in StatCrunch, resulting in a variance of 13. The script then explains how to calculate the mean of the sample variances by storing the results in the data table for further analysis. The video emphasizes the theoretical equivalence of the population variance and the mean of the sample variances, given that variance is an unbiased estimator. However, due to the small sample size, some disparity may exist. The correct answer is chosen based on the understanding that variance is an unbiased estimator, meaning the sample variances should target the population variance, making it a good estimator.
Mindmap
Keywords
💡Variance
💡Sampling Distribution
💡Probability Distribution Table
💡Sample Size (n)
💡Replacement
💡Population
💡Estimator
💡Unbiased Estimator
💡StatCrunch
💡Mean of Sample Variances
💡Aspire Mountain Academy
Highlights
Introduction to creating a variance sampling distribution and probability distribution table.
Explanation of the problem statement involving three households with varying numbers of people.
Assumption of samples of size n equals two selected with replacement from the population.
Instructions to complete Parts A through C of the problem.
Guidance on finding the variance of each of the nine samples.
Preference for using Excel or StatCrunch for solving the problem.
Step-by-step guide on inputting data into StatCrunch.
Using StatCrunch to calculate variance for each sample.
Sorting the variance values to create a probability distribution table.
Explanation of how to calculate probabilities for each variance value.
Comparison of population variance to the mean of sample variances in Part B.
Importance of understanding biased and unbiased estimators.
Variance as an unbiased estimator and its implications.
Advice on memorizing the list of biased and unbiased estimators for problem-solving.
Part C's focus on whether sample variances target the population variance value.
Emphasis on the theoretical understanding over specific numerical answers.
Encouragement to leave comments for feedback and improvement suggestions.
Promotion of Aspire Mountain Academy for more statistics learning resources.
Transcripts
Browse More Related Video
Math 14 HW 6.3.7-T Is the sample variance an unbiased estimator of the population variance?

6.3.4 Sampling Distribution and Estimators - Sampling Distribution of Sample Variance
6.3.5 Sampling Distributions and Estimators - Biased and Unbiased Estimators
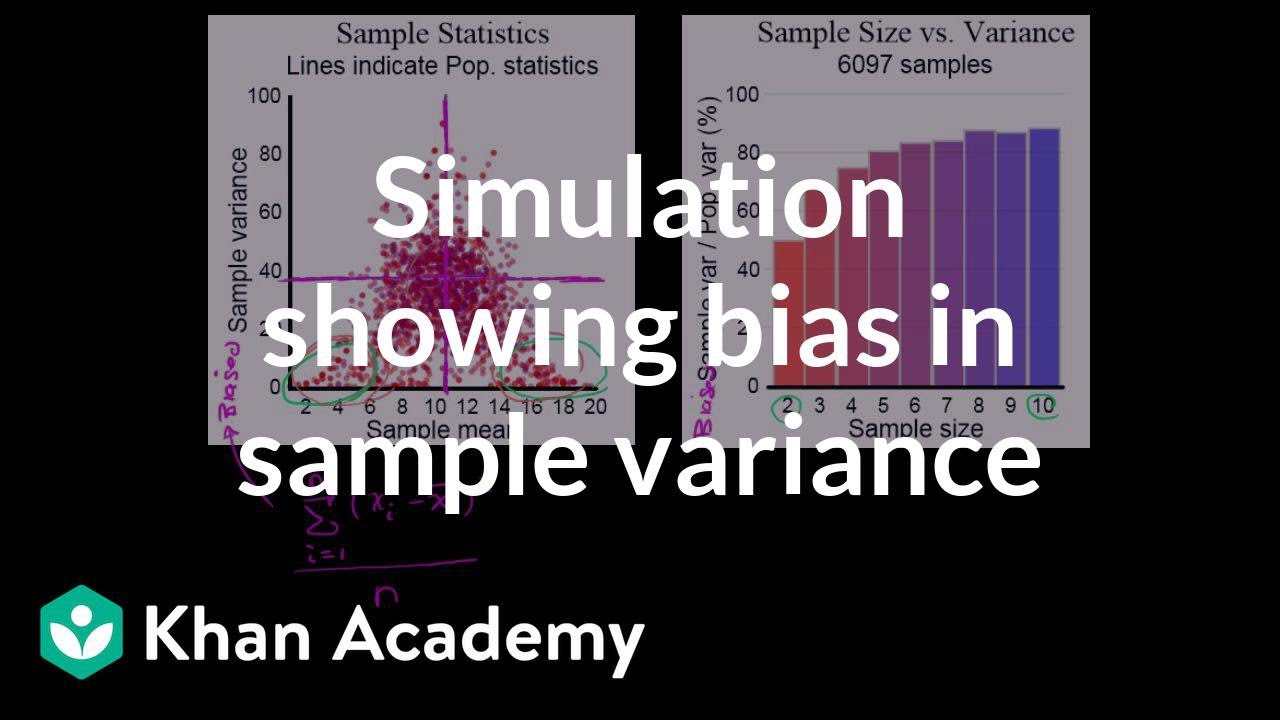
Simulation showing bias in sample variance | Probability and Statistics | Khan Academy
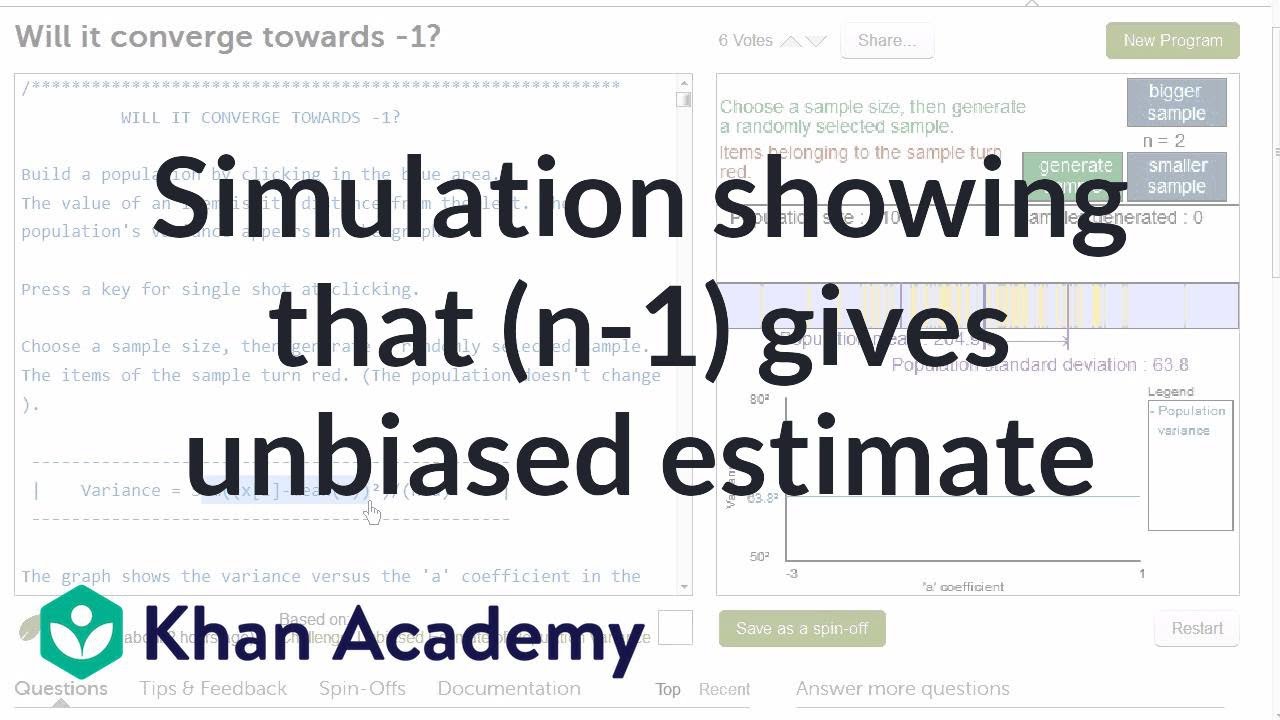
Simulation providing evidence that (n-1) gives us unbiased estimate | Khan Academy
What is an unbiased estimator? Proof sample mean is unbiased and why we divide by n-1 for sample var
5.0 / 5 (0 votes)
Thanks for rating: