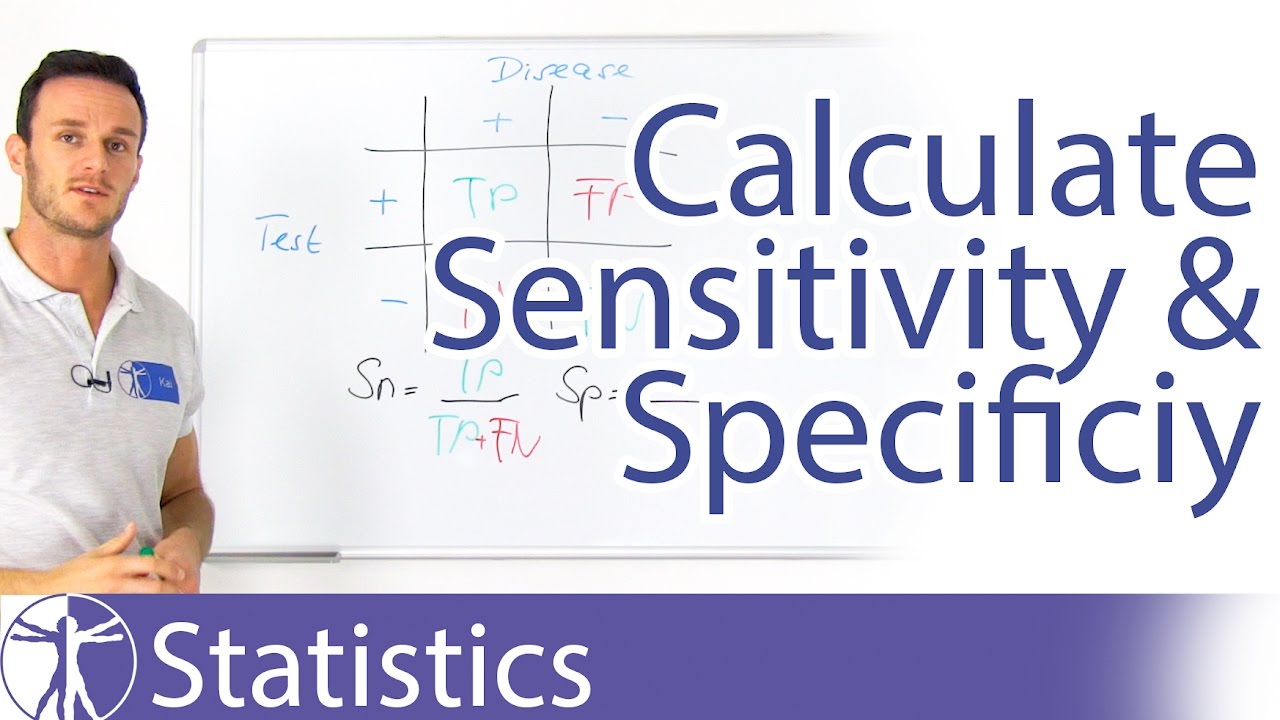
EBM: predictive values
TLDRThe video script discusses the concepts of positive and negative predictive values in medical testing, emphasizing their dependence on disease prevalence. It explains how these values are calculated by considering the true positives, false positives, true negatives, and false negatives in a two-by-two table. The script illustrates how predictive values can vary with different disease prevalence rates, highlighting the importance of considering the patient population's actual disease prevalence when interpreting test results. It concludes by mentioning the use of likelihood ratios as an alternative when prevalence rates differ between study populations.
Takeaways
- 🔍 Understanding Predictive Values: Positive Predictive Value (PPV) indicates how often a positive test result is correct, while Negative Predictive Value (NPV) indicates the accuracy of a negative test result.
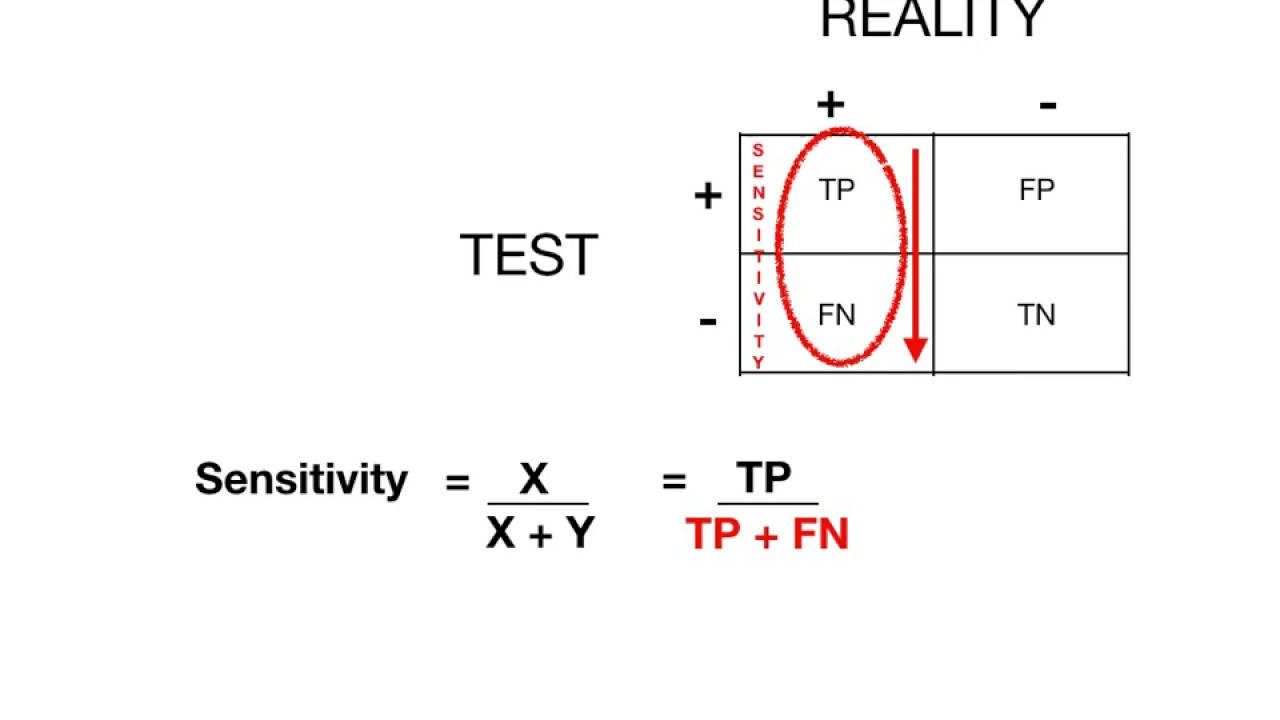
- 🌟 Sensitivity and Specificity: Sensitivity is crucial for ruling out a disease (a high sensitivity test helps avoid false negatives), and specificity is important for ruling in a disease (a high specificity test helps avoid false positives).
- 📈 Two-by-Two Table: The table helps in analyzing the performance of a diagnostic test by categorizing patients into true positives, true negatives, false positives, and false negatives.
- 👨⚕️ Clinical Application: In clinical practice, the focus is on making inferences about a patient's disease status based on test results, not comparing tests directly.
- 🤔 Prevalence Impact: Predictive values are highly dependent on the prevalence of the disease in the population. The same test can have different PPVs and NPVs in populations with different disease prevalence rates.
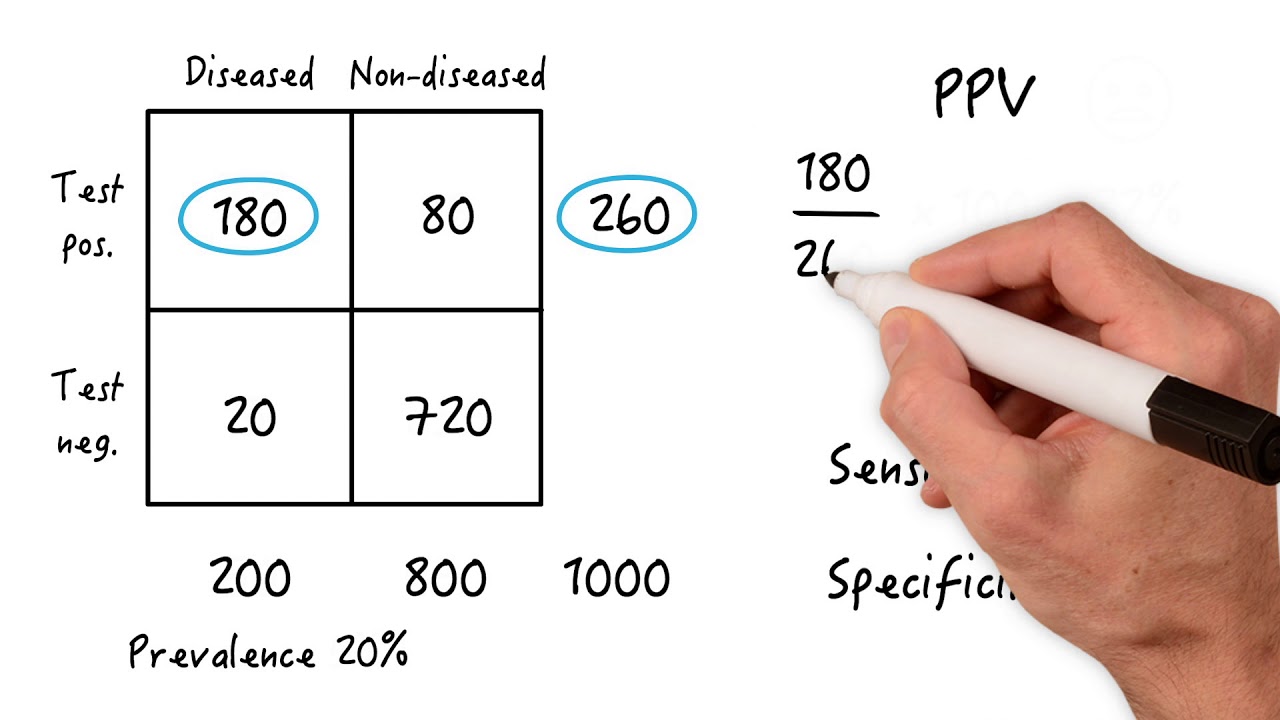
- 🔄 Calculating PPV and NPV: PPV is calculated as true positives divided by all positive tests (true positives + false positives), while NPV is calculated as true negatives divided by all negative tests (true negatives + false negatives).
- 📉 PPV and Disease Rarity: In a population with a lower prevalence of disease, the PPV of a test decreases because there are more false positives.
- 📈 NPV and Disease Rarity: Conversely, NPV increases in populations with lower disease prevalence because a negative test is more likely to be correct.
- 📊 PPV and Disease Commonality: In populations with a higher prevalence of disease, the PPV of a test increases because the likelihood of a positive test being correct is higher.
- 📉 NPV and Disease Commonality: With a higher prevalence, the NPV decreases because a negative test is less likely to be correct due to the higher number of actual cases.
- ⚠️ Caution with Predictive Values: When applying predictive values from a study, it's critical to ensure that the disease prevalence in the study population matches that of the target population; otherwise, the predictive values may not be reliable.
- 🔄 Alternative Measures: When prevalence differs, likelihood ratios can be used as an alternative to predictive values for a more accurate assessment of test performance.
Q & A
What are the two main types of predictive values discussed in the transcript?
-The two main types of predictive values discussed are positive predictive value and negative predictive value.
What does a high sensitivity test indicate when it's negative?
-A test with high sensitivity, when it's negative, helps you rule out a disease with a good degree of certainty.
What does a high specificity test indicate when it's positive?
-A test with high specificity, when it's positive, helps you rule in a disease with confidence.
How is positive predictive value calculated?
-Positive predictive value is calculated by dividing the number of true positives by the total number of positive tests (true positives + false positives).
How is negative predictive value calculated?
-Negative predictive value is calculated by dividing the number of true negatives by the total number of negative tests (true negatives + false negatives).
What is the significance of prevalence in relation to predictive values?
-Prevalence significantly affects predictive values because they are highly dependent on the proportion of the population that actually has the disease.
How does changing the prevalence of a disease affect the predictive values?
-Changing the prevalence of a disease will alter the positive predictive value and the negative predictive value. For a rarer disease, the positive predictive value decreases and the negative predictive value increases, while for a more common disease, the positive predictive value increases and the negative predictive value decreases.
Why should you be cautious when applying predictive values from a study to a different population?
-You should be cautious because if the prevalence of the disease in the study population does not match the prevalence in your population, the predictive values are likely to be different and may not accurately reflect the true positive or negative outcomes.
What is the purpose of using a two-by-two table in understanding predictive values?
-The two-by-two table helps visualize and organize the outcomes of a diagnostic test, allowing for the calculation of predictive values by considering the true positives, true negatives, false positives, and false negatives.
How does the concept of positive and negative predictive values relate to clinical practice?
-In clinical practice, positive and negative predictive values help healthcare providers make informed decisions about a patient's health condition based on the results of a diagnostic test, considering the likelihood of the disease being present or absent.
What is an example scenario where a high positive predictive value is beneficial?
-A high positive predictive value is beneficial in situations where early and accurate diagnosis of a disease is crucial, ensuring that when a test comes back positive, the patient indeed has the disease and can receive timely treatment.
What is an example scenario where a high negative predictive value is beneficial?
-A high negative predictive value is beneficial in screening programs where the goal is to rule out diseases, as it means that a negative test result is highly reliable in confirming that the individual does not have the disease.
Outlines
🔍 Understanding Predictive Values in Medical Testing
This paragraph discusses the concepts of positive and negative predictive values in the context of medical testing. It contrasts these with sensitivity and specificity, which were covered in a previous video. The speaker explains that while sensitivity and specificity are useful for comparing tests, predictive values are what clinicians use to make inferences about patients' disease status based on test results. The paragraph introduces the two-by-two table used to calculate these values, highlighting the importance of prevalence in affecting predictive values. It sets the stage for a deeper exploration of these concepts in the following paragraphs.
📊 Calculating Predictive Values with Prevalence
The second paragraph delves into the calculation of positive and negative predictive values, emphasizing how these values are influenced by the prevalence of the disease in the population. Using a hypothetical scenario with 40 people, the speaker demonstrates how the predictive values change with different disease prevalences. The paragraph illustrates that a test's positive predictive value decreases and its negative predictive value increases as the disease becomes rarer in the population. Conversely, with a more common disease, the positive predictive value rises, and the negative predictive value falls. This section underscores the importance of considering disease prevalence when interpreting test results.
⚠️ Limitations of Predictive Values and the Role of Likelihood Ratios
The final paragraph addresses the limitations of relying solely on predictive values, particularly when the prevalence of the disease in the study population does not match that of the target population. The speaker warns that using predictive values from a study with different prevalence can lead to incorrect conclusions. Instead, the paragraph introduces likelihood ratios as an alternative tool that can be used to make more accurate inferences about a patient's disease status, regardless of prevalence. The speaker concludes by encouraging viewers to look forward to learning about likelihood ratios in future content.
Mindmap
Keywords
💡Predictive Values
💡Sensitivity
💡Specificity
💡True Positives
💡True Negatives
💡False Negatives
💡False Positives
💡Prevalence
💡Two-by-Two Table
💡Likelihood Ratios
Highlights
The discussion revolves around predictive values in medical testing, specifically sensitivity and specificity.
Sensitivity is the ability of a test to correctly identify those with a disease.
Specificity is the ability of a test to correctly identify those without a disease.
A test with high sensitivity is preferred when trying to rule out a disease.
A test with high specificity is preferred when trying to confirm a disease.
In clinical practice, the focus is often on making inferences about a patient's disease status based on test results.
Positive Predictive Value (PPV) is the probability that a positive test result indicates the actual presence of a disease.
Negative Predictive Value (NPV) is the probability that a negative test result indicates the actual absence of a disease.
Predictive values are calculated differently from sensitivity and specificity, using horizontal calculations across the 2x2 table.
A high PPV indicates a high likelihood that a positive test result is correct.
A high NPV indicates a high likelihood that a negative test result is correct.
Predictive values are highly dependent on the prevalence of the disease in the population.
Changing the prevalence of a disease in a sample affects the PPV and NPV of a test.
In a sample with a higher prevalence of disease, the PPV increases and the NPV decreases.
In a sample with a lower prevalence of disease, the PPV decreases and the NPV increases.
The limitations of predictive values include their reliance on the prevalence of disease, which may not match the actual population.
When the prevalence in a study does not match the target population, predictive values should be used with caution.
Likelihood ratios, which will be discussed in a future video, offer a way to adjust for differences in disease prevalence.
Transcripts
Browse More Related Video


5.0 / 5 (0 votes)
Thanks for rating: