Sensitivity, Specificity, PPV, NPV
TLDRThis video offers a comprehensive guide on creating and utilizing a 4x4 table for answering biostatistics questions effectively during exams. It emphasizes the importance of using the initial exam time to sketch out this table on a whiteboard, detailing the placement of true positives, false positives, false negatives, and true negatives. The video further explains the axes of reality and test outcomes, and introduces a mnemonic-based method, 'the dirty USMLE method', to remember the calculations for sensitivity, specificity, positive predictive value, and negative predictive value. This method simplifies understanding by associating the direction of arrows with concepts of being brought down by sensitivity, moving up by specificity, and shifting in the positive or negative directions for predictive values. This strategic approach aims to make biostatistics questions straightforward and manageable, promising an efficient way to secure easy marks.
Takeaways
- 📝 Use the first 15 minutes of the exam to draw a 4x4 table on your whiteboard for biostats questions.
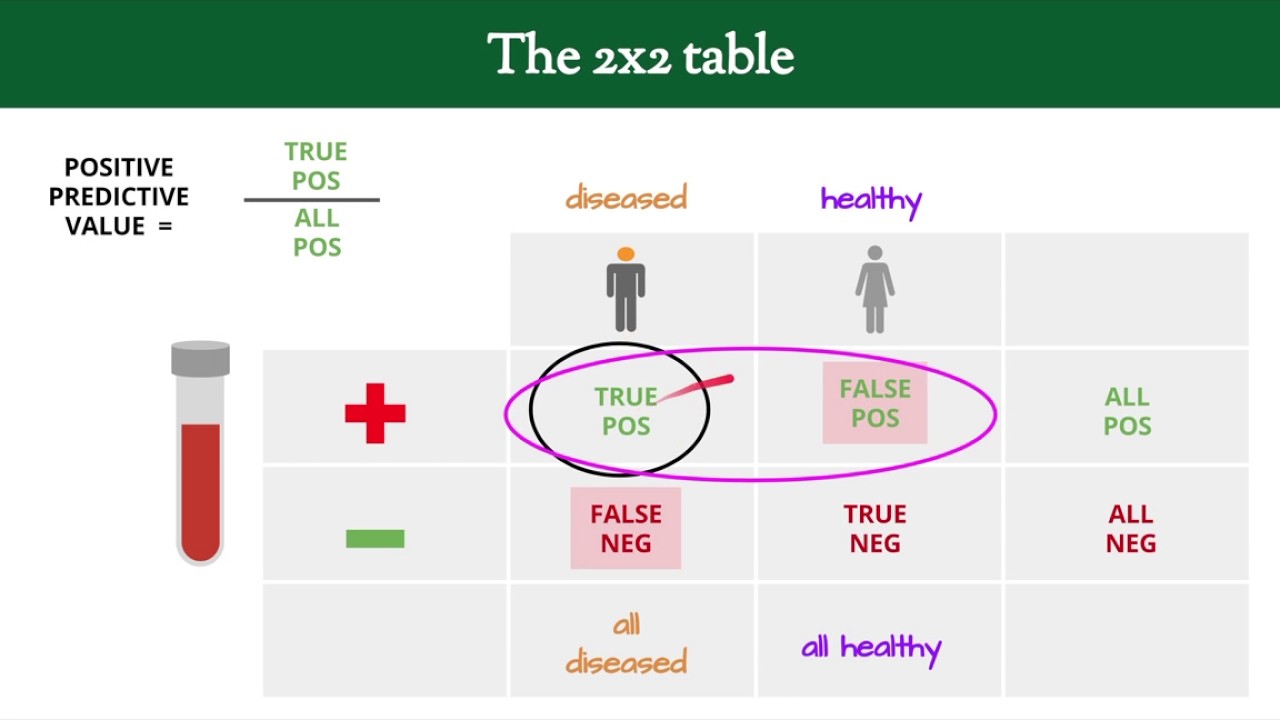
- 🎯 Place positives in the top left corner and negatives in the boxes to the right and down one.
- 📊 Label the axes: across the top 'Reality' and on the left side 'Test', indicating the test results and actual conditions.
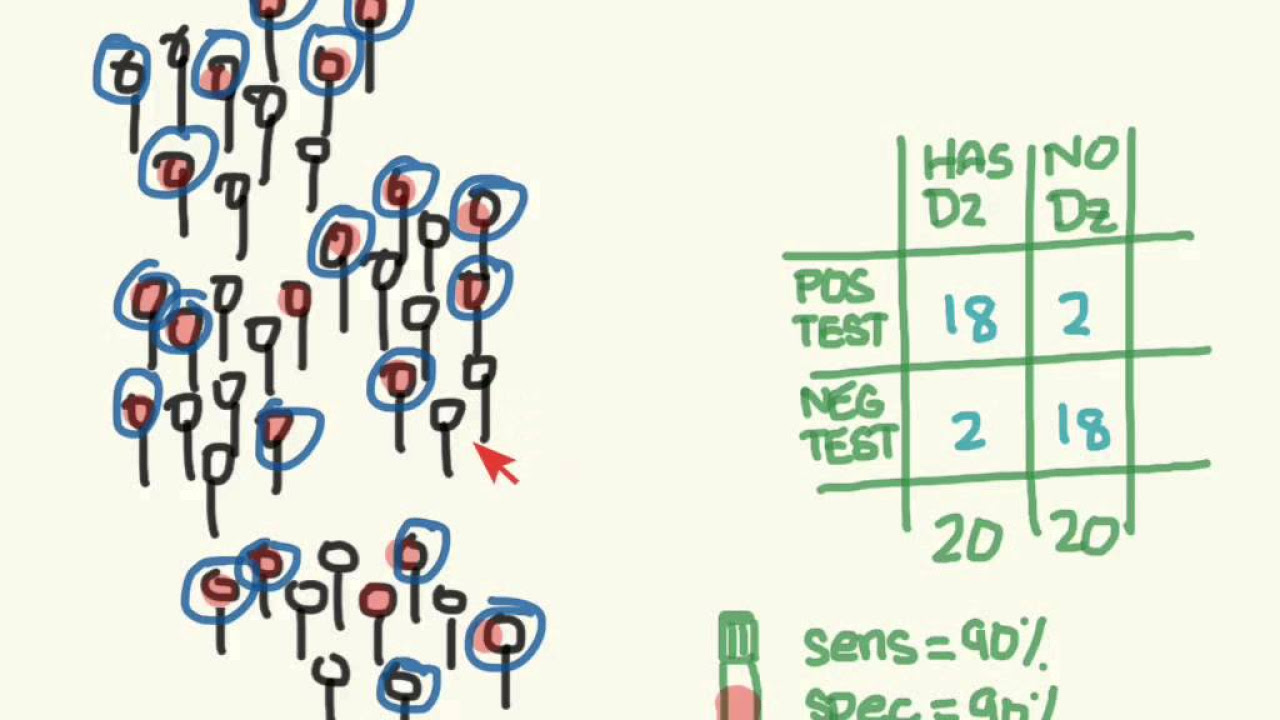
- 🔍 Fill in the table with True Positives (TP), False Negatives (FN), False Positives (FP), and True Negatives (TN).
- 👍 True Positive: Test positive and actually have the disease.
- ❌ False Negative: Test negative but actually have the disease.
- 🚫 False Positive: Test positive but do not have the disease.
- ✔️ True Negative: Test negative and do not have the disease.
- 📈 Abbreviate the table with TP, FP, FN, and TN for easier reference.
- 🔑 Equations for sensitivity, specificity, positive predictive value (PPV), and negative predictive value (NPV) follow the format X/(X+Y).
- 💡 Use mnemonics: 'overly sensitive = down', 'overly specific = up', 'positive = right', 'negative = left' to remember arrow directions for each value.
- 📚 Understand the 4x4 table and arrow directions to easily derive any biostatistics question formulas on the exam.
Q & A
What is the purpose of creating a 4x4 table on test day according to the transcript?
-The purpose is to organize and have all necessary values and formulas readily available for answering biostatistics questions during the exam.
What does the 'reality' axis represent in the 4x4 table?
-The 'reality' axis, positioned across the top of the table, represents whether an individual actually has or does not have the disease in question.
What is the significance of the placement of positives and negatives in the 4x4 table?
-Positives are placed in the top left corner, and negatives follow to the right and down. This arrangement helps in correctly assigning the outcomes of tests relative to the reality of having or not having a disease.
How is a 'true positive' defined in the context of the 4x4 table?
-A true positive occurs when the test result is positive and the individual actually has the disease, reflecting an accurate test outcome.
What does a 'false negative' indicate in the table?
-A false negative indicates that the test result is negative despite the individual actually having the disease, showing a missed detection by the test.
How are the equations for sensitivity, specificity, positive predictive value, and negative predictive value structured?
-All these equations follow a structure of X/(X+Y), where X and Y are derived from the counts of true positives, false positives, false negatives, and true negatives, depending on the measure being calculated.
What mnemonic is used to remember the direction of the arrow for sensitivity in the 4x4 table?
-The mnemonic is that if you're overly sensitive, you'll be brought down, representing a downward arrow from true positive to false negative for sensitivity.
How is specificity represented with an arrow in the 4x4 table, and why?
-Specificity is represented with an upward arrow, symbolizing that being highly specific in life helps you move up, applied from true negative to false positive.
What logic is applied to remember the direction for the arrow of positive predictive value?
-The logic is that if you're positive, you move in the positive direction on a graph, leading to an arrow going from left to right for positive predictive value.
What does the mnemonic for negative predictive value suggest about its arrow direction?
-The mnemonic suggests that negative predictive value moves in the negative direction, represented by an arrow pointing from right to left.
Outlines
📚 Mastering the 4x4 Table for Biostats Exams
This paragraph introduces a strategic approach to tackling biostatistics questions in exams by creating a 4x4 table during the initial 15 minutes provided for instruction reading. It emphasizes the importance of knowing where to place positive and negative results within the table and associating these with the reality of disease presence or absence and test outcomes. The content guides through the process of populating the table, starting with distinguishing between true positives, false negatives, false positives, and true negatives, and progresses to replacing these terms with abbreviations for ease of reference throughout the video. It establishes the groundwork for understanding complex concepts by starting with the basics of reality versus test results and sets the stage for deeper discussions on sensitivity, specificity, and predictive values using a unique arrow-drawing method to simplify equations.
🎯 Understanding Sensitivity and Specificity through Arrows
This segment delves into the concepts of sensitivity and specificity within the context of the 4x4 table, employing a memorable 'arrow method' to visually and conceptually grasp these statistical measures. Sensitivity is associated with a downward arrow, symbolizing the impact of being overly sensitive in life, whereas specificity's upward arrow illustrates advancement due to precision and accuracy. The explanation extends to deriving equations for both measures, where the direction of the arrow (down for sensitivity, up for specificity) influences the formula construction, highlighting the numerator (where the arrow starts) and the denominator (the start plus the end). This innovative approach aims to solidify the viewer's understanding of how to accurately apply these measures in exam scenarios.
🌟 Deciphering Positive and Negative Predictive Values
The final part of the script introduces positive and negative predictive values, rounding off the comprehensive guide to mastering biostatistics questions involving the 4x4 table. It continues to utilize the arrow method for easy recall and application, with positive predictive value represented by an arrow moving in the positive (rightward) direction, and negative predictive value by an arrow moving in the negative (leftward) direction. The segment explains how to derive equations for these values, focusing on the placement of true positives, false positives, true negatives, and false negatives, and their implications for the test's predictive capacity. The summary emphasizes the utility of these visual and conceptual aids in simplifying the complex task of calculating biostatistical measures, ensuring the viewer is well-prepared for exam questions on this topic.
Mindmap
Keywords
💡4x4 Table
💡True Positive
💡False Negative
💡False Positive
💡True Negative
💡Sensitivity
💡Specificity
💡Positive Predictive Value (PPV)
💡Negative Predictive Value (NPV)
💡Mnemonics
💡Biostatistics
Highlights
Recommendation to use the first 15 minutes of exam time to draw a 4x4 table on a whiteboard for biostatistics questions.
Explanation on how to organize the 4x4 table with positives and negatives for test results and reality.
Introduction of terms 'true positive', 'false negative', 'false positive', and 'true negative' with examples.
Replacement of full terms with abbreviations for clarity and ease of reference.
Overview of equations for calculating sensitivity, specificity, positive predictive value, and negative predictive value as ratios.
Demonstration of how to use directional arrows in the table to easily remember and calculate equations.
Sensitivity explained as a downward arrow, symbolizing being 'brought down' by being overly sensitive.
Specificity explained as an upward arrow, symbolizing advancement or 'moving up' due to being specific.
Positive predictive value associated with moving in the positive direction on a graph.
Negative predictive value associated with moving in the negative direction on a graph.
A mnemonic for sensitivity: being overly sensitive brings you down.
A mnemonic for specificity: being specific takes you up in life.
The significance of understanding the 4x4 table for acing biostatistics questions in exams.
A promise for further videos with specific examples and calculations based on the 4x4 table.
Highlighting the 'dirty USMLE 4x4 method' as a highly effective study tool for mastering biostatistics questions.
Transcripts
Browse More Related Video

How to calculate Sensitivity and Specificity

Sensitivity and Specificity simplified
EBM: predictive values

Understanding Sensitivity, Specificity, Positive Predictive Value and Negative Predictive Value

Sensitivity and Specificity for the USMLE
Clinical Reasoning 6: Sensitivity, Specificity & Predictive Values
5.0 / 5 (0 votes)
Thanks for rating: