StatsCast: What is a t-test?
TLDRThis video script from the 'Stats Cast' series aims to demystify the concept of T-tests for beginners. It explains the purpose of T-tests, how they function to determine if the average differences between two groups are statistically significant, and when they should be used. The script covers the distinction between descriptive and inferential statistics, illustrates the T-test's calculation with an example involving a cholesterol-lowering drug, and discusses the importance of P values in assessing reliability. It also touches on the different types of T-tests, including independent samples, paired samples, and one-sample tests, and concludes with guidelines on how to interpret T-test results.
Takeaways
- 📊 T-tests are statistical methods used to determine if the averages of two groups are reliably different.
- 🔍 The purpose of a T-test is to go beyond mere description and provide inferential statistics that allow generalization to a larger population.
- 🎯 T-tests measure the ratio of variance between groups to variance within groups, represented by the T value.
- 📉 A higher T value indicates a more significant difference between group means compared to the variability within the groups.
- 🤔 The reliability of the difference is assessed through the P value, which represents the probability that the observed difference could be due to chance.
- 📍 A commonly accepted threshold for statistical significance is a P value of 0.05 or lower.
- 🔢 Sample size affects the P value; larger samples can more easily detect statistically significant differences.
- 👥 There are three main types of T-tests: independent samples, paired samples, and one-sample tests, each suited for different research designs.
- 📚 The assumptions for T-tests include having a sample and population that are roughly normally distributed and having the same number of scores in each group.
- 📐 Data for T-tests should be at least interval level, meaning that the difference between scores is consistent across the scale.
- 📝 When reporting T-test results, the T value, P value, degrees of freedom, and group means are typically presented to indicate the significance and direction of the difference.
Q & A
What is the primary purpose of a T-test?
-The primary purpose of a T-test is to check if the averages or means of two groups are reliably different.
Why can't we rely solely on looking at the means to determine a difference between two groups?
-Looking at the means can tell us if there is any difference at all, but it doesn't tell us if the difference is reliable or if it's just due to chance.
What is the difference between descriptive and inferential statistics?
-Descriptive statistics only describe the sample we have and don't tell us if our results are likely to happen again, while inferential statistics, like the T-test, tell us what we can expect in new samples and allow us to generalize our findings to a whole population.
How does the T-test determine if the difference between two groups is reliable?
-The T-test measures the difference between the groups and compares it to the difference within the groups. It calculates a T value, which is a ratio of variance between groups over variance within groups.
What does a T value of three indicate in a T-test?
-A T value of three means that the two groups are about three times as different from each other as they are within themselves, indicating a significant difference.
What is the significance of the P value in a T-test?
-The P value is the probability that the pattern produced by our data could be produced by random data. It tells us whether the difference between our groups is real or just a fluke.
What is the general cutoff for a P value to be considered statistically significant in most research?
-In most research, the cutoff for a P value to be considered statistically significant is 0.05 or below.
How does sample size affect the P value in a T-test?
-Bigger samples make it easier to find statistically significant differences. The exact P value associated with a T value depends on the sample size, and the benefit of larger samples diminishes as the sample size increases.
What are the three main types of T-tests?
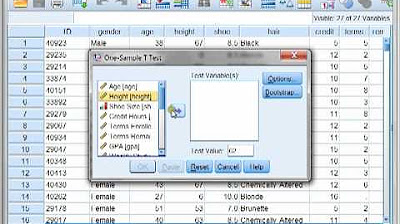
-The three main types of T-tests are the independent samples T-test, the paired samples T-test, and the one-sample T-test.
What are some limitations of using a T-test?
-Limitations include the need for the sample and population to be roughly normally distributed, having close to the same number of scores in each group, ensuring data points are independent, and requiring data to be at least interval level.
How can you determine if a significant difference exists between two groups based on a T-test result?
-If the P value is less than 0.05, the difference is considered reliable or statistically significant, indicating a significant difference between the two groups.
Outlines
📊 Understanding T-tests: Purpose and Basics
This paragraph introduces the concept of T-tests, explaining their purpose and fundamental workings. It clarifies that T-tests are used to determine if the averages of two groups are reliably different, which is not always evident just by looking at the means. The explanation distinguishes between descriptive and inferential statistics, emphasizing the power of T-tests as an inferential tool to generalize findings to a larger population. The paragraph uses the example of a cholesterol-lowering drug to illustrate the need for inferential statistics and introduces the concept of T-value as a ratio comparing variance between and within groups. It also explains the significance of P-values in determining the reliability of observed differences.
🔍 Deep Dive into T-test Types and Considerations
The second paragraph delves into the different types of T-tests, including independent samples, paired samples, and one-sample tests, providing examples for each. It discusses the historical development of T-tests and their application in quality control, such as in the Guinness beer batches. The paragraph also addresses the importance of sample size, or degrees of freedom, in T-tests and the impact of sample size on statistical power and P-value outcomes. Furthermore, it outlines the limitations of T-tests, such as the requirement for normal distribution of data, equal group sizes, independence of data points, and interval level data. It concludes with guidance on how to interpret and report T-test results, including the significance of T-values and P-values in determining statistical reliability.
Mindmap
Keywords
💡T Test
💡Descriptive Statistics
💡Inferential Statistics
💡Means
💡Variance
💡T Value
💡P Value
💡Degrees of Freedom
💡Sample Size
💡Statistical Power
💡Normal Distribution
💡Independent Samples T Test
💡Paired Samples T Test
💡One Sample T Test
Highlights
Stats cast is a series designed to explain statistical concepts in a clear and simple manner, even for those without prior experience.
T tests are used to check if the averages or means of two groups are reliably different.
Looking at the means alone does not indicate the reliability of the difference between groups.
Descriptive statistics describe the sample, while inferential statistics generalize findings to a population.
The T test is an inferential statistic that measures the ratio of variance between groups to variance within groups.
A higher T value indicates a more significant difference between groups compared to the variance within groups.
The P value represents the probability that the observed data pattern could be due to chance.
A P value threshold of 0.05 or below is typically considered statistically significant.
Sample size affects the P value; larger samples can more easily detect significant differences.
Degrees of freedom for T tests is calculated as the sample size minus one.
There are three main types of T tests: independent samples, paired samples, and one sample tests.
The independent samples T test compares two different groups, such as in the cholesterol experiment.
The paired samples T test measures one group at two different times, reducing variability between subjects.
The one sample T test compares a group to a hypothetical value or known population mean.
T tests have limitations, including the requirement for the sample and population to be roughly normally distributed.
Data points in a T test should be independent, and the sample size should be balanced between groups.
If data does not meet T test assumptions, alternative methods like the Mann-Whitney test can be used.
T test results are typically presented with the test name, T value, P value, degrees of freedom, and group means.
Transcripts
Browse More Related Video

t-Test - Full Course - Everything you need to know
One sample t-test vs Independent t-test vs Paired t-test
Three Different t tests using SPSS with Dr Ami Gates

T-Tests: A Matched Pair Made in Heaven: Crash Course Statistics #27

SPSS (9): Mean Comparison Tests | T-tests, ANOVA & Post-Hoc tests

Student's t-test
5.0 / 5 (0 votes)
Thanks for rating: