How Do You Graph Motion? | Physics in Motion
TLDRThis educational segment from 'Physics in Motion' demonstrates how to graphically represent motion through a case study of Summer, who moves from a food truck to her car. It covers how to use position versus time graphs to depict and calculate both instantaneous and average velocities by drawing tangent lines and determining slopes. Additionally, it explains the concepts of displacement, acceleration, and velocity with practical examples, including how to interpret different slopes and lines on these graphs. The video concludes with transitions into velocity versus time graphs and acceleration versus time graphs, further elaborating on how motion is analyzed in physics.
Takeaways
- 📈 Graphs are a powerful tool to visualize and analyze motion, offering an easy and accurate way to represent movement.
- 🚶♀️ To graph motion, consider the displacement, velocity, acceleration, and time of the object in motion.
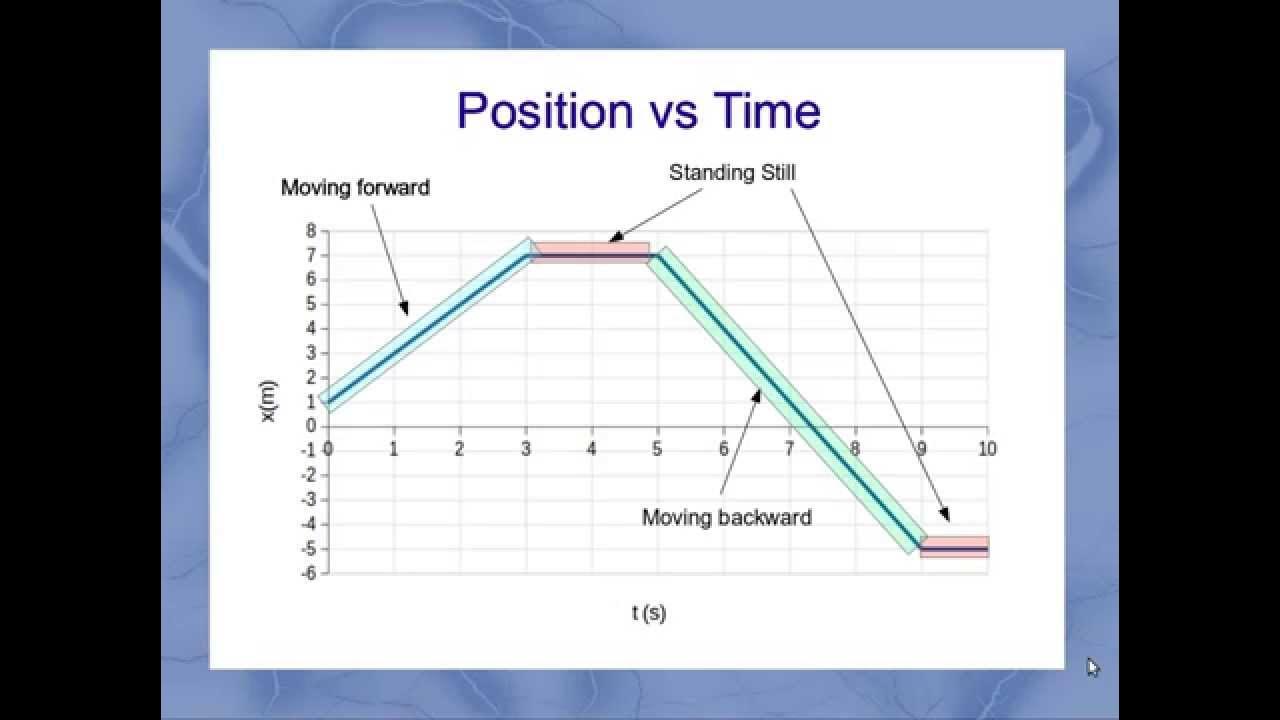
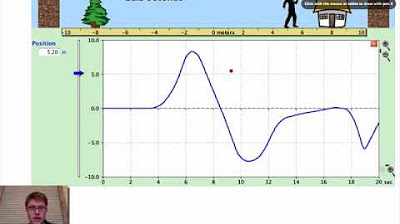
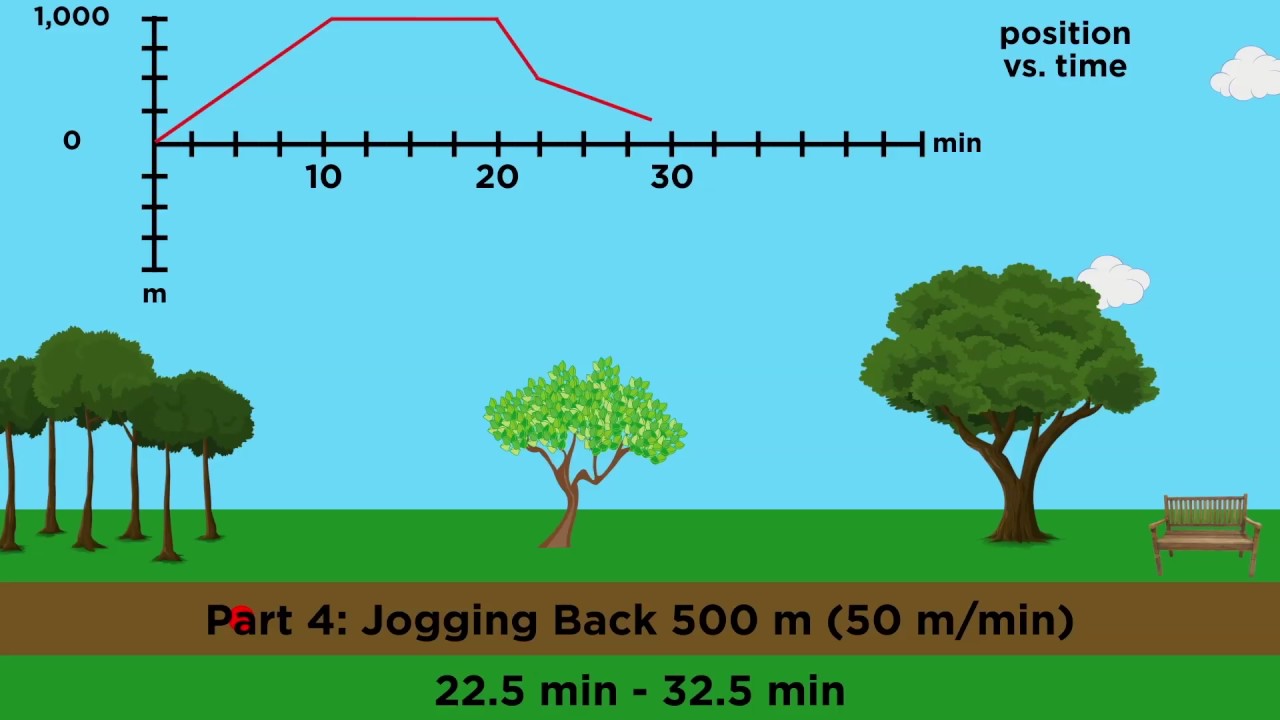
- 📊 A position versus time graph can be used to plot an object's movement over time, with the vertical axis for position and the horizontal for time.
- 🔍 The instantaneous velocity at a specific time can be found by drawing a tangent line to the graph and calculating its slope.
- ⏱️ Average velocity is determined by the total displacement divided by the total time taken for the journey.
- 📐 The slope of a line connecting two points on a graph represents the velocity or acceleration over that time interval.
- 🔵 A straight line ascending on a position versus time graph indicates a constant positive velocity.
- 🟡 A horizontal line on a position versus time graph signifies that the object has stopped moving.
- 🔻 A line descending on the graph indicates a constant negative velocity, showing the object is moving back toward the origin.
- 🚀 A curving line upwards on a position versus time graph represents an increasing velocity, or acceleration.
- 🏃♀️ A curving line downwards indicates deceleration, or negative acceleration.
- 📌 Displacement over a time period can be found by calculating the change in position (final minus initial position).
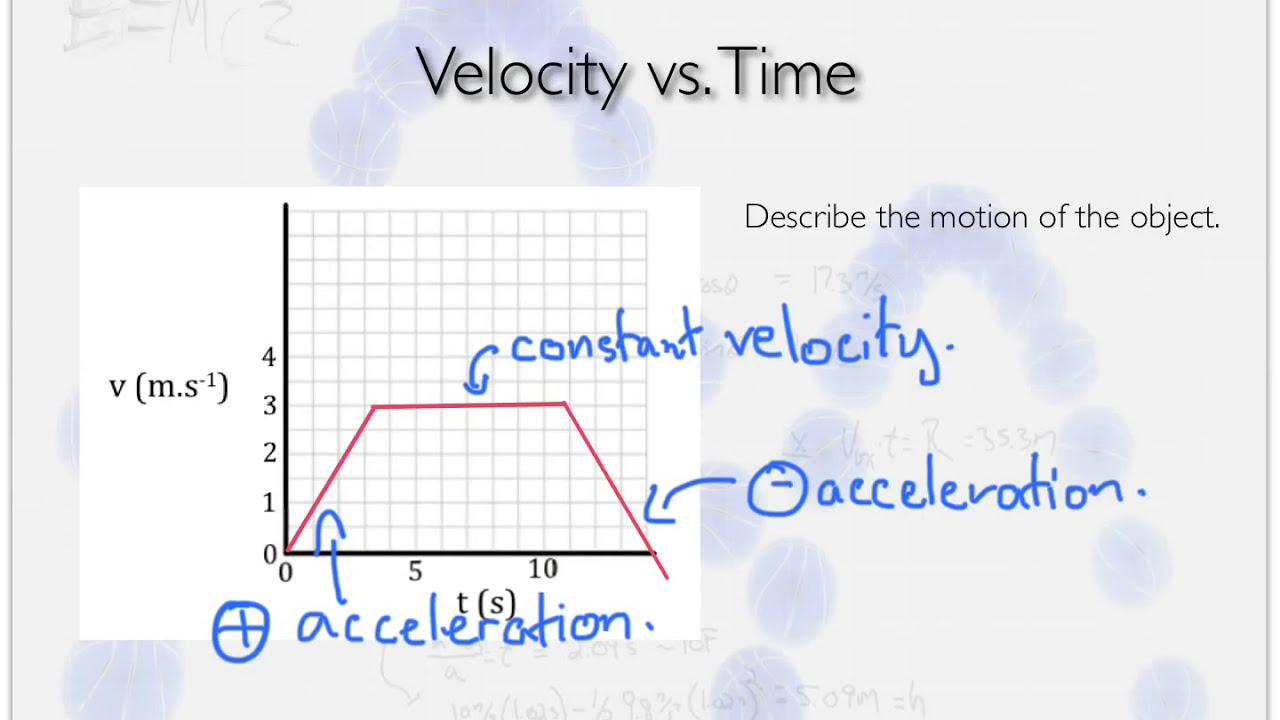
- 📉 A velocity versus time graph has velocity on the y-axis and time on the x-axis, allowing us to plot how velocity changes over time.
- 🔳 A horizontal line on a velocity versus time graph indicates a constant velocity, whether positive or negative.
- 📍 Instantaneous and average acceleration can be graphed similarly to velocity, by finding the slope of the tangent or the line over a time interval.
Q & A
What is the purpose of using a position vs. time graph in physics?
-A position vs. time graph in physics is used to visually represent the movement of an object over time, showing how the position changes in relation to time. This allows for an easy and accurate depiction of motion, helping to understand concepts like displacement, velocity, and acceleration.
How do you calculate instantaneous velocity from a position vs. time graph?
-Instantaneous velocity can be calculated by finding the slope of the tangent line at a specific point on a position vs. time graph. This involves drawing a straight line that just touches the graph at the point of interest and extends infinitely in both directions. The slope of this tangent line, calculated as the change in position divided by the change in time (delta y/delta x), gives the instantaneous velocity.
What does a horizontal line on a position vs. time graph indicate about the motion of the object?
-A horizontal line on a position vs. time graph indicates that the object is stationary, with no change in position over time. This represents a zero velocity, as the object's location remains constant.
How do you find the average velocity of an object from a position vs. time graph?
-The average velocity of an object is determined by the slope of the line connecting two points on a position vs. time graph. This slope is calculated as the change in position (delta y) divided by the change in time (delta x) between these two points, which represents the total displacement divided by the total time elapsed.
What does a line with a positive slope on a position vs. time graph indicate?
-A line with a positive slope on a position vs. time graph indicates that the object is moving away from the origin in a positive direction, showing positive constant velocity. The steeper the slope, the faster the velocity of the object.
What is represented by a line that curves upward on a position vs. time graph?
-A line that curves upward on a position vs. time graph represents an object that is speeding up, indicating positive acceleration. The curvature of the line suggests increasing velocity over time.
How can you use a velocity vs. time graph to find acceleration?
-Acceleration can be found using a velocity vs. time graph by calculating the slope of the line at any point or over an interval. For instantaneous acceleration, draw a tangent line at the specific moment and find its slope. For average acceleration, draw a line connecting two points over a time interval and calculate the slope of this line.
What does a negative value on a velocity vs. time graph indicate?
-A negative value on a velocity vs. time graph indicates that the object is moving in the opposite direction of the positive axis, essentially moving back towards the origin. This is known as negative velocity.
How do you calculate displacement using a position vs. time graph?
-Displacement can be calculated by finding the change in position between two points on a position vs. time graph. This is done by subtracting the initial position (x initial) from the final position (x final), which gives the overall displacement over the selected time period.
What does a line on an acceleration vs. time graph at zero indicate?
-A line at zero on an acceleration vs. time graph indicates that there is no acceleration; the object either maintains a constant velocity or is stationary. This represents a state where no net forces are acting to accelerate the object.
Outlines
📈 Understanding Graphs of Motion
This paragraph introduces the concept of using graphs to represent movement, which can be done through equations or graphical representation. The focus is on how to draw graphs of motion, which is an efficient and precise way to display movement information. The example of Summer's journey from a food truck to her car with a sandwich is used to illustrate how to apply physics concepts such as displacement, velocity, acceleration, and time to a graph. The paragraph explains how to find instantaneous velocity at a specific time by drawing a tangent line and calculating its slope, as well as how to calculate average velocity over the entire journey. It also describes how to interpret different types of lines on a graph, such as straight lines for constant velocity, horizontal lines for stopped movement, and curved lines for acceleration or deceleration. Finally, it discusses how to calculate displacement over a time interval.
🚀 Graphing Velocity and Acceleration
The second paragraph delves into the specifics of graphing velocity and acceleration over time. It begins by explaining how to represent velocity on the y-axis and time on the x-axis, with the example of Summer's motion. The paragraph demonstrates how to plot constant velocity, stopped motion, and negative velocity on a velocity versus time graph. It also shows how to represent acceleration graphically, with a positive slope indicating speeding up and a negative slope indicating slowing down. The concept of instantaneous and average acceleration is introduced, with methods for calculating them on a velocity versus time graph paralleling those used for velocity on a position versus time graph. The paragraph concludes with an example of how to graph acceleration over time, using Summer's actions during her lunch break to illustrate different phases of motion, including periods of no acceleration, speeding up, and slowing down.
Mindmap
Keywords
💡Position
💡Velocity
💡Acceleration
💡Graph
💡Displacement
💡Slope
💡Tangent Line
💡Instantaneous Velocity
💡Average Velocity
💡Kinematic Equations
Highlights
Introduction to graphing motion, emphasizing the simplicity and effectiveness of graphs in physics.
Explanation of how to represent displacement, velocity, acceleration, and time using graphs.
The process of drawing a tangent line on a position vs. time graph to find instantaneous velocity.
Using a slope equation to calculate instantaneous velocity from a graph.
Illustration of calculating average velocity over a time interval using the slope of a line on a graph.
Differentiation between positive constant velocity, stopped motion, and negative velocity using slopes on a position vs. time graph.
Explanation of how lines that curve on the graph indicate acceleration or deceleration.
Introduction to finding displacement between two time points on a position vs. time graph.
Overview of how to use a velocity vs. time graph to plot changes in velocity over time.
Description of graphing average and instantaneous acceleration on a velocity vs. time graph.
Explanation of the acceleration vs. time graph and its implications for movement dynamics.
Highlighting the utility of graphing for understanding motion in a clear and interactive way.
Summarizing the advantages of using various types of graphs to represent motion in physics education.
Call to action for further practice with graphing motion through additional resources in the 'Physics in Motion' toolkit.
Transcripts
Browse More Related Video
Position vs Time, Velocity vs Time & Acceleration vs Time Graph (Great Trick to Solve Every Graph!!)
Visualizing Motion Using Tape Charts and Motion Graphs | SCIENCE 7 QUARTER 3 MODULE 2 WEEK 3
Graphs of Motion : Easy and Quick Summary
Interpreting Motion Graphs
Position vs. Time Graph - Part 2
Position/Velocity/Acceleration Part 2: Graphical Analysis
5.0 / 5 (0 votes)
Thanks for rating: