Chi Square Distribution Test of a Single Variance or Standard Deviation
TLDRThis video explains how to perform a hypothesis test using a chi-square distribution to compare a sample variance to a hypothesized population variance. Given a hypothesized standard deviation of exam scores (8.6), a professor samples 20 scores. With a sample standard deviation of 6.9 and significance level of 0.05, the null hypothesis states the variance equals 8.6 squared. The alternative states the variance is less. Using the sample data, degrees of freedom, and chi-square distribution tables, a calculated chi-square statistic is determined. Since this falls in the 'do not reject' region, there is insufficient evidence to reject the null hypothesis that the true variance equals the hypothesized value of 8.6 squared.
Takeaways
- 😀 The video explains how to perform a hypothesis test using a chi-square distribution for a single variance
- 📊 The hypothesis is that the standard deviation of exam scores is less than 8.6
- 📐 A sample of 20 exam scores had a standard deviation of 6.9
- 🚩 The null hypothesis is that the variance equals 8.6 squared
- 🚩 The alternative hypothesis is that the variance is less than 8.6 squared
- 🔢 This is a left-tailed test with a significance level of 0.05
- 📈 The critical chi-square value with 19 degrees of freedom and 0.95 area to the right is 10.117
- 🖩 The calculated chi-square value using the sample data is 12.23
- ❌ Since the calculated value exceeds the critical value, we do not reject the null hypothesis
- 📊 There is not enough evidence to suggest the true standard deviation is less than 8.6
Q & A
What is the hypothesized standard deviation and variance for the exam scores?
-The hypothesized standard deviation is 8.6 and the hypothesized variance is 8.6 squared, which is 73.96.
What are the sample standard deviation and variance for the 20 exam scores sampled?
-The sample standard deviation is 6.9 and the sample variance is 6.9 squared, which is 47.61.
What is the sample size and degrees of freedom used?
-The sample size is 20 exam scores. The degrees of freedom is the sample size minus 1, which is 20 - 1 = 19.
What are the null and alternative hypotheses?
-The null hypothesis is that the variance is equal to 8.6 squared or 73.96. The alternative hypothesis is that the variance is less than 8.6 squared, because the professor believes the true variance is less than that.
What kind of hypothesis test is this based on the alternative hypothesis?
-This is a left-tailed test because the alternative hypothesis states that the true variance is less than 8.6 squared.
What is the critical value from the chi-square distribution table?
-With 19 degrees of freedom and 95% of the area to the right, the critical chi-square value is 10.117.
How is the calculated chi-square value determined?
-The calculated chi-square value uses the formula: (n - 1) * (sample variance) / (hypothesized population variance). Plugging in the values gives: 12.23.
What conclusion is reached about the hypothesis?
-Since the calculated chi-square value of 12.23 exceeds the critical value of 10.117, the sample does not provide enough evidence to reject the null hypothesis.
What would need to happen to reject the null hypothesis?
-The calculated chi-square value would need to fall in the rejection region, which is to the left of the critical value in this left-tailed test. So if the calculated value was less than 10.117, we could reject the null hypothesis.
What is the overall significance of the hypothesis test results?
-The sample standard deviation of 6.9 does not provide sufficient evidence to suggest the true population standard deviation of exam scores is less than the hypothesized value of 8.6. Therefore, more evidence is needed to support the professor's belief.
Outlines
😀 Performing a Hypothesis Test with Single Variance
This paragraph explains the details of a hypothesis test problem. It provides the hypothesized and sample standard deviations and variances, the sample size, degrees of freedom, null and alternative hypotheses, identifies it is a left-tailed test, calculates the critical value from a chi-square table, and graphs the distribution showing the rejection region.
😐 Calculating and Interpreting the Chi-Square Statistic
This paragraph covers calculating the chi-square statistic using the provided formula, finding a value of 12.23. It interprets this value in context of the hypothesis test by comparing to the critical value, concluding that the sample does not provide enough evidence to reject the null hypothesis.
Mindmap
Keywords
💡hypothesis test
💡standard deviation
💡sample variance
💡null hypothesis
💡alpha value
💡critical value
💡calculated statistic
💡degrees of freedom
💡rejection region
💡chi-square distribution
Highlights
The problem states a professor believes the standard deviation of exam scores to be less than the current 8.6 value
The sample size is 20 exam scores with a standard deviation of 6.9
Using a significance level of 0.05
The null hypothesis is the variance is equal to 8.6 squared
The alternative hypothesis is the variance is less than 8.6 squared based on the professor's belief
This is a left-tailed test because the alternative hypothesis states the variance is less than the null value
The chi-square critical value with 19 degrees of freedom and 0.95 area to the right is 10.117
The calculated chi-square value using the sample data is 12.23
12.23 exceeds the critical value 10.117, so we do not reject the null hypothesis
The sample does not provide enough evidence to reject the null hypothesis
The hypothesized standard deviation is 8.6
The hypothesized variance is 8.6 squared
The sample standard deviation is 6.9
The sample variance is 6.9 squared
The sample size is 20
Transcripts
Browse More Related Video
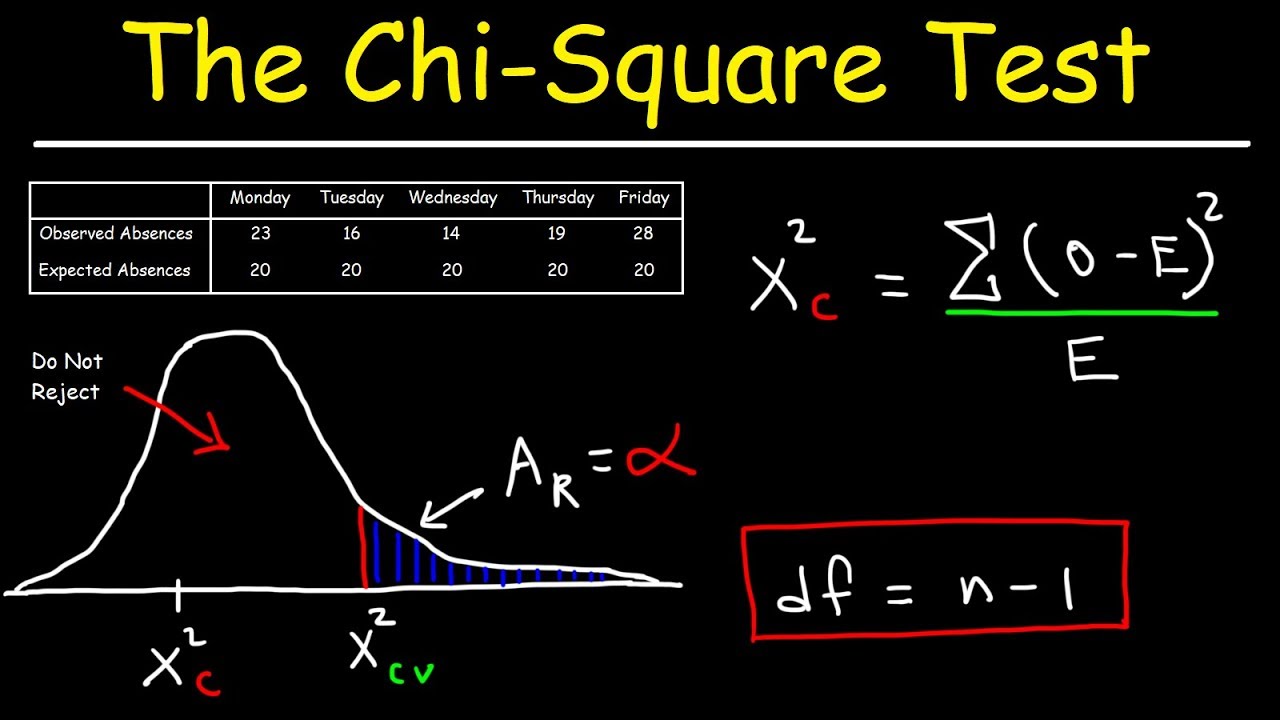
Chi Square Test
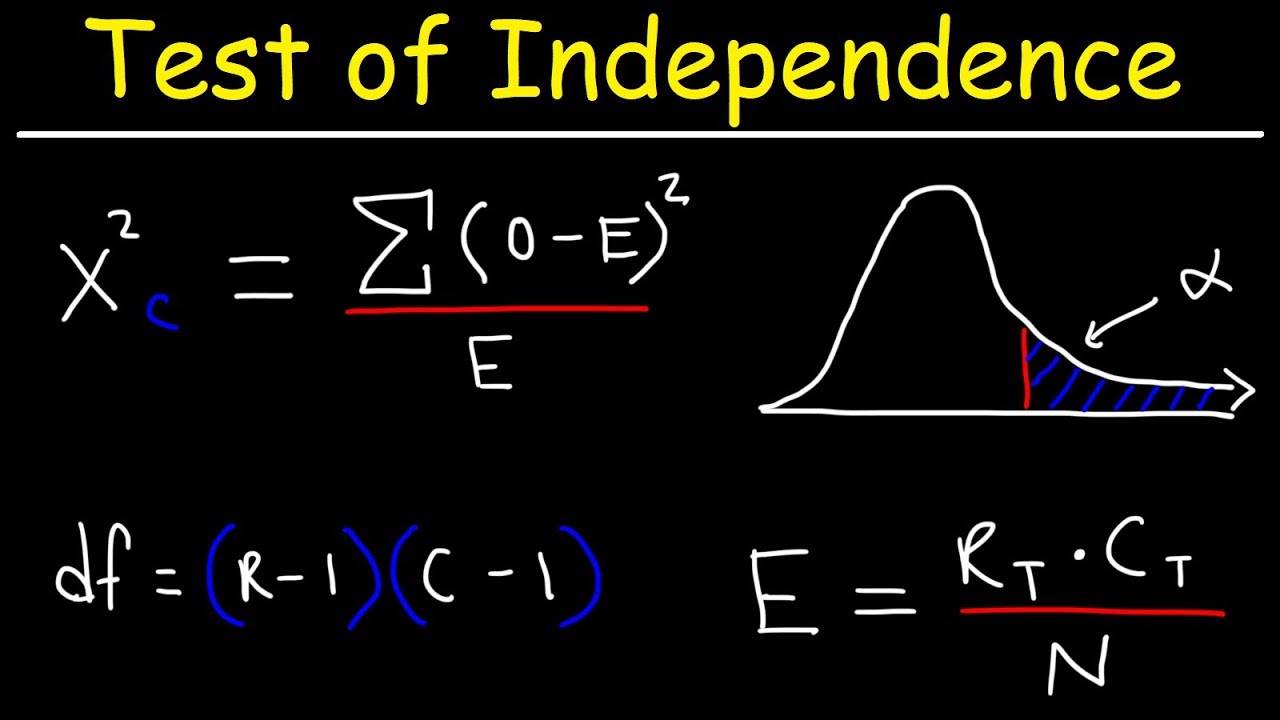
Test of Independence Using Chi-Square Distribution

Explaining The One-Sample t-Test
Finding degrees of freedom, critical values, and a standard deviation confidence interval estimate
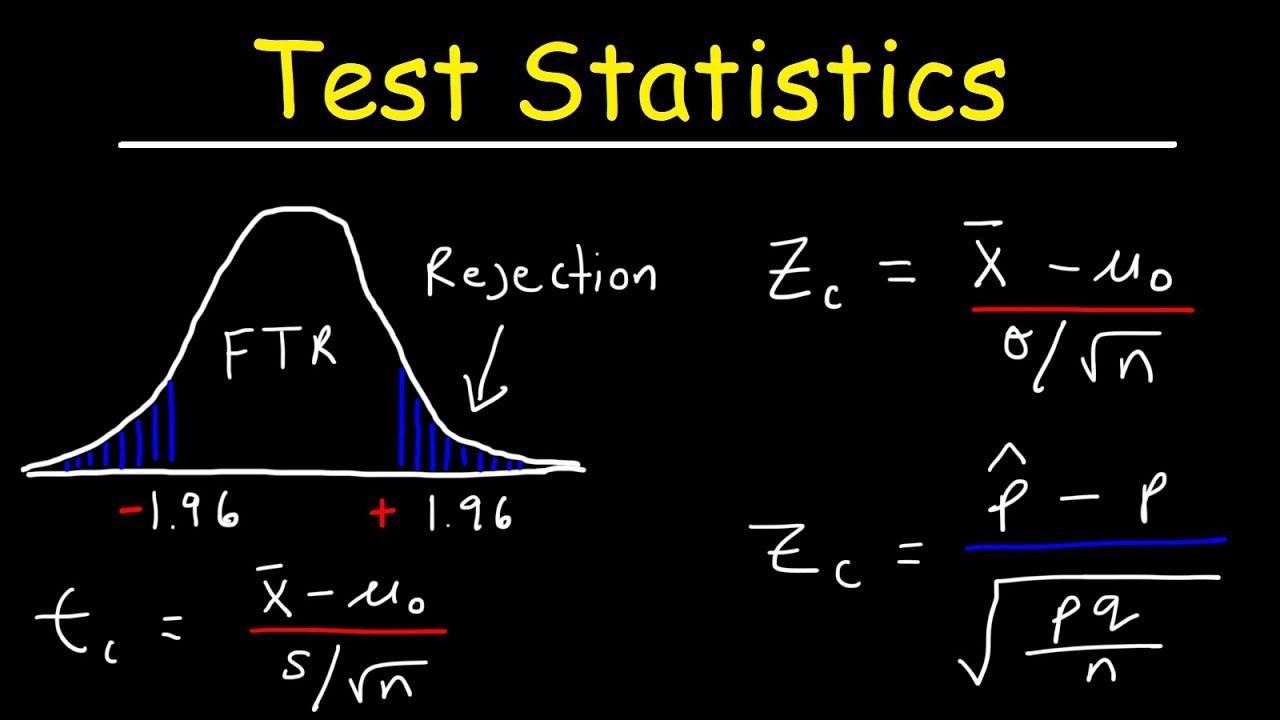
Test Statistic For Means and Population Proportions
Why do we divide by n-1 and not n? | shown with a simple example | variance and sd
5.0 / 5 (0 votes)
Thanks for rating: