Playing with Power: P-Values Pt 3: Crash Course Statistics #23
TLDRThis video explains concepts related to hypothesis testing and making errors in statistics. It covers type I and type II errors, statistical power, and ways to minimize errors. Effect size and sample size are discussed in relation to distributions and detecting effects. The goal is to provide viewers a strong basis for using p-values and testing ideas properly in the future.
Takeaways
- 😀 We want to limit errors in hypothesis testing as much as possible. There are two main types of errors: Type I (false positive) and Type II (false negative).
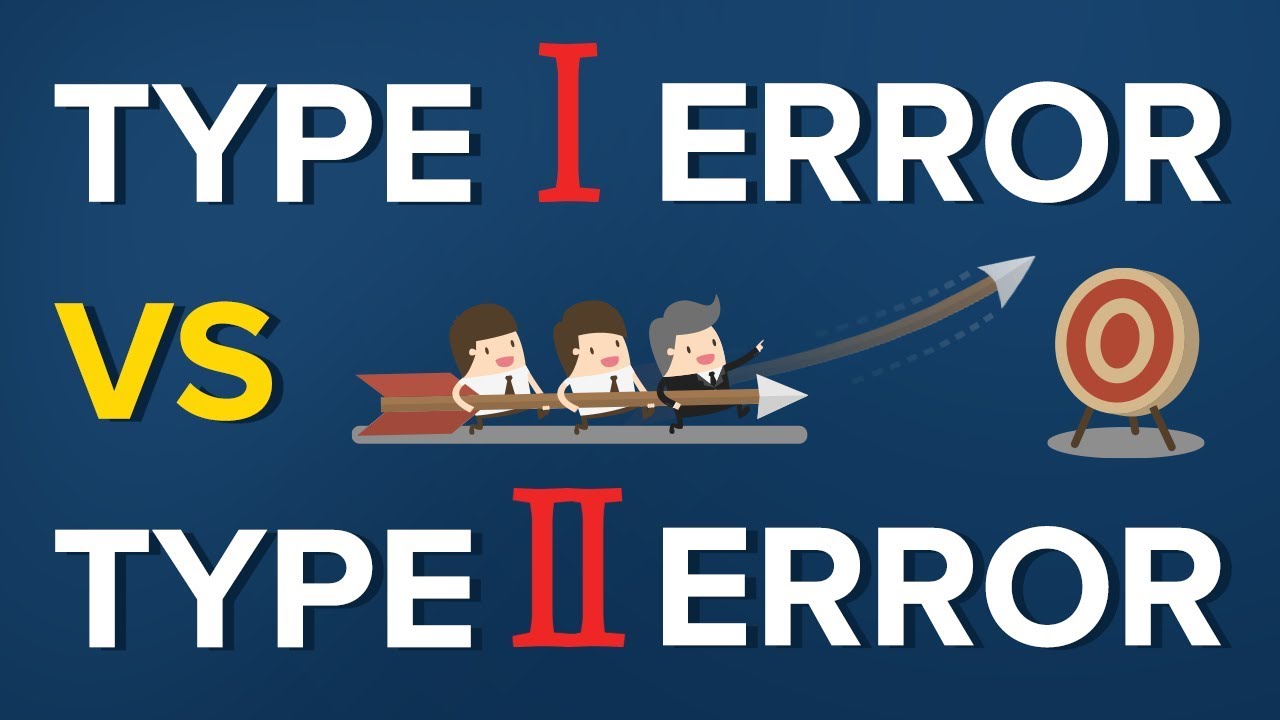
- 😞Type I error occurs when we reject the null hypothesis even though it is actually true. The rate of Type I errors is equal to our significance level α.
- 👍 We control Type I errors by explicitly choosing α, the rate at which we're willing to make them.
- 😟 Type II error happens when we fail to reject the null hypothesis even though the alternative hypothesis is true. The rate of Type II errors is β.
- 🔎 There is often a tradeoff between Type I and Type II errors. We may prefer one type over the other depending on context.
- 😊 When the null hypothesis is true, we'll correctly fail to reject it 1 - α percent of the time.
- 📈 Statistical power tells us the chance of detecting an effect if one exists. Higher power means we're more likely to correctly reject the null hypothesis when it's false.
- 📊 We can increase statistical power by increasing sample size or effect size (difference between groups). A larger effect is easier to detect.
- ⏩ Across fields, 80% statistical power is often considered sufficient when designing studies.
- 😀 Understanding types of errors and statistical power helps us design better experiments and correctly interpret results.
Q & A
What are the two options when looking at p-values in relation to a pre-selected cutoff?
-The two options are: 1) Reject the null hypothesis if the p-value is lower than the pre-selected cutoff, or 2) Fail to reject the null hypothesis if the p-value is not lower than the cutoff.
What are the four possible outcomes when making a decision about the null hypothesis?
-The four possible outcomes are: 1) Correctly reject the null hypothesis, 2) Mistakenly reject the null hypothesis (Type I error), 3) Correctly fail to reject the null hypothesis, 4) Mistakenly fail to reject the null hypothesis (Type II error).
How can researchers control Type I errors?
-Researchers can control Type I errors by explicitly deciding on an alpha level, which determines how often they are willing to make Type I errors. A lower alpha means fewer Type I errors.
What is the difference between Type I and Type II errors?
-A Type I error is rejecting the null hypothesis when it is actually true (false positive). A Type II error is failing to reject the null hypothesis when it is actually false (false negative).
Why might researchers prefer one type of error over the other?
-Researchers may prefer Type I or Type II errors depending on the context and relative costs of each type of error. For example, false alarms in smoke detectors are preferred over failing to detect actual fires.
How does changing the cutoff threshold affect Type I and Type II errors?
-Moving the cutoff threshold to the right increases Type I errors but decreases Type II errors. Moving it to the left does the opposite.
What does statistical power tell us?
-Statistical power tells us the chance of detecting an effect if one exists. Higher power means a higher chance of detecting a real effect.
What are two ways researchers can increase statistical power?
-Two ways to increase statistical power are: 1) Increase sample size, and 2) Increase the effect size by having the groups be more different from each other.
Why is statistical power important?
-Statistical power is important because it represents a study's ability to detect effects if they exist. We want sufficient power so that we can reliably identify effects.
What percentage power do researchers often aim for?
-Across many fields, researchers aim for at least 80% statistical power in their studies to ensure a reasonable ability to detect effects.
Outlines
😊 Introducing Errors in Null Hypothesis Significance Testing
This paragraph introduces the concepts of type I and type II errors in null hypothesis significance testing. It explains the four possible outcomes when making a decision to reject or fail to reject the null hypothesis, two of which are errors. It defines a type I error as incorrectly rejecting a true null hypothesis, with a rate equal to the significance level alpha. It defines a type II error as failing to reject a false null hypothesis, with an estimated rate called beta.
😮 Balancing Type I and Type II Errors
This paragraph discusses the tradeoff between type I and type II errors using real-world examples like smoke alarms and risk-averse people. It visually shows how moving the significance threshold affects the rates of each error type. It also uses the story of the boy who cried wolf to give a memorable analogy.
💪 Understanding Statistical Power
This paragraph defines statistical power as the probability of correctly rejecting the null hypothesis when it is false. It discusses the factors that affect power, mainly effect size and sample size. It emphasizes the importance of power in detecting true effects and not wasting resources on underpowered studies. It states that researchers aim for 80% power when designing experiments.
Mindmap
Keywords
💡Null Hypothesis
💡p-value
💡Type I Error
💡Type II Error
💡Statistical Power
💡Effect Size
💡Sampling Distribution
💡Fail to reject H0
💡Reject H0
💡Alpha level
Highlights
P-values tell us how "rare" or "extreme" our sample data would be if it really did come from the null distribution.
When we get low p-values, we "reject" the null hypothesis because we've decided that our data would be pretty rare if the null was true.
The first error is called a Type I error, which is rejecting the null, even if it's true.
Type I errors are essentially False positives: we think we've detected an effect, but there isn't one.
Type II errors are False negatives: there was an effect, we just didn’t see it.
If the error types hard to keep straight, think of the Boy who cried wolf.
Statistical power tells us our chance of detecting an effect if there is one.
If two things are really different from each other, it's easier to tell them apart.
Effect size tells us how big the difference in neuroticism is between the two groups.
As you increase the size of your samples, the distribution of sample means gets thinner.
The more data we have, the more information we have.
Researchers can't magically change the efficacy of a drug, or the difference in heart rate between people who do kickboxing and people who do Crossfit.
Across many fields it’s considered sufficient to have 80% statistical power or more.
Often when researchers are designing studies, they’ll decide how many subjects they need based on estimates of effect size and power.
In the next few episodes we’ll talk a lot more about exactly when and how you can use p-values.
Transcripts
Browse More Related Video

Power Analysis
Type I error vs Type II error
Statistical POWER and Power Analysis
Introduction to power in significance tests | AP Statistics | Khan Academy
Type I and II Errors, Power, Effect Size, Significance and Power Analysis in Quantitative Research
Power Calculations in Hypothesis Testing | Statistics Tutorial #17 | MarinStatsLectures
5.0 / 5 (0 votes)
Thanks for rating: