ANOVA Part 2: Dealing with Intersectional Groups: Crash Course Statistics #34
TLDRThis video explains factorial ANOVAs, which allow analyzing data with multiple categorical grouping variables. It uses examples like car prices by manufacturer and color, and olive oil ratings by bottle style and taster expertise. Factorial ANOVAs determine if groups differ significantly on the outcome, if the grouping variables impact the outcome independently, and if they interact with each other. Interactions are when the effect of one variable depends on the level of another. Finally, the video covers interpreting effect sizes of factorial ANOVA results.
Takeaways
- 😃 Factorial ANOVAs can analyze the effects of multiple categorical independent variables on a continuous dependent variable.
- 💡 Main effects vs interaction effects - main effects look at the impact of one independent variable averaged across levels of the others; interactions explore if the effect of one independent variable varies across levels of another.
- 😮 Significant interactions can change the interpretation of main effects - they indicate the relationship between variables is more complex.
- 😊 Looking at effect sizes like eta squared helps assess practical significance of effects in addition to statistical significance.
- 📉 ANOVA tables break down variation in the DV into components to quantify effects of IVs.
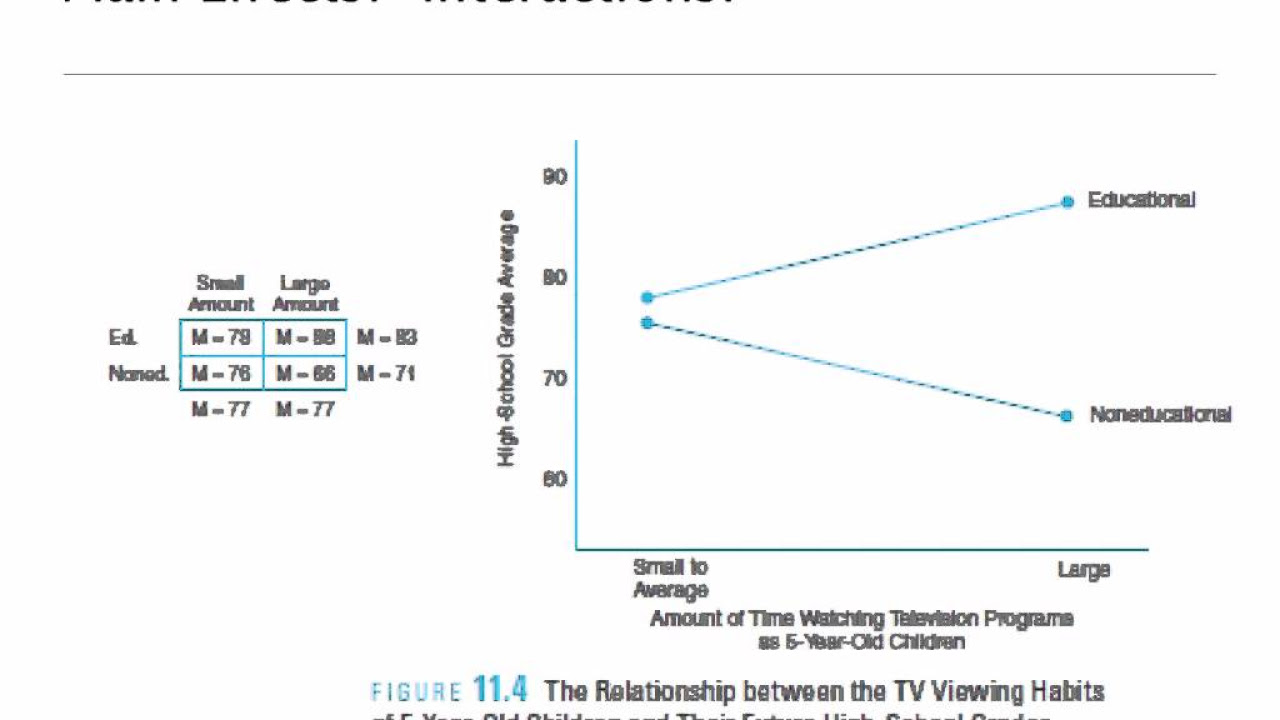
- 📊 Interaction plots visually display how the effect of one IV differs across levels of another.
- 🥑 Example: Both expertise level and bottle style impact how olive oil is rated, but their interaction shows only novices rate fancy bottles higher.
- 🚗 Example: Manufacturer significantly impacts car price, while color does not. An interaction between them went unexplored.
- 🔬 Comparing groups allows richer understanding of how factors interact vs studying them in isolation.
- 😀 Tools like factorial ANOVAs help uncover subtleties in relationships between categorical variables.
Q & A
What is a factorial ANOVA used for?
-A factorial ANOVA is used when you want to look at the effects of two or more independent grouping variables on a continuous dependent variable. For example, studying the effects of car manufacturer and car color on sedan prices.
How do you calculate the F-statistic in an ANOVA?
-The F-statistic is calculated as the ratio between the scaled Sums of Squares for a variable and the scaled Sums of Squares for the Error. These scaled versions are called Mean Squares.
What does a significant F-test tell you?
-A significant F-test tells you that the result is statistically significant. However, it does not necessarily mean the result is practically significant or has a large real-world effect.
What is eta squared?
-Eta squared is a measure of effect size for ANOVAs. It tells you the proportion of total variation in the data that is accounted for by a specific variable or model.
What is an interaction in a factorial ANOVA?
-An interaction occurs when the effect of one independent variable depends on the level of another independent variable. For example, color may affect Lamborghini prices but not Toyota prices.
How do you detect an interaction in a factorial ANOVA?
-You can detect an interaction by adding an interaction term to your statistical model. A significant p-value for the interaction term indicates the presence of an interaction.
What is an interaction plot?
-An interaction plot visually displays the means for each combination of your independent variables. Non-parallel lines indicate an interaction between the variables.
How do you interpret main effects when there is an interaction?
-If there is a significant interaction, main effects should be interpreted cautiously. The interaction means the effect of one variable changes across levels of another variable.
What type of bottle should the olive oil shop owner choose?
-The data showed an interaction where novices rated the olive oil higher in fancy bottles while experts were not swayed by bottle style. Since there were few experts in town, the owner should choose the fancy bottles.
What topics related to the video would be useful to study further?
-Some topics that may warrant further study include other effect size measures for ANOVA, handling assumptions in factorial models, implementing the analyses in statistical software, and interpreting complex interactions.
Outlines
😮 How Factorial ANOVAs Examine Multiple Groups At Once
This paragraph introduces factorial ANOVAs, which allow you to analyze the effects of multiple grouping variables or factors simultaneously, up to hundreds. It shows an example examining car prices using manufacturer and color as factors. It explains how a factorial ANOVA partitions out variation to quantify the impact of each factor, presenting the information in an ANOVA table. Significant effects indicate statistical significance, while effect sizes like eta squared show practical significance.
🤔 Interactions Show When Factors Affect Each Other
This paragraph discusses interactions, which occur when the effect of one factor depends on another factor. An example analyzes how expertise level and bottle style interact to impact olive oil rating. The interaction plot and ANOVA table demonstrate a significant interaction while other main effects are not significant. Interpreting main effects requires caution when interactions are present since the impact may differ across groups.
😊 Understanding Groups, Their Interactions Has Many Applications
The concluding paragraph summarizes that individuals and things belong to multiple, often interacting groups. Tools like factorial ANOVAs help uncover these dynamics around factors like demographics and preferences. The example showed how the customer base and bottle choices interactively impact perceptions of olive oil quality. Recognizing these complex group dynamics leads to richer understanding.
Mindmap
Keywords
💡ANOVA
💡interaction
💡factorial ANOVA
💡main effect
💡sums of squares
💡F-statistic
💡p-value
💡effect size
💡means
💡variation
Highlights
When comparing groups, there isn’t always one single box that we can put someone into.
Things and people belong to multiple groups. And those groups can overlap or interact.
We want to look at sedan prices to figure out how they’re affected by manufacturer, and color.
If we’re interested in how car manufacturer and color affect price, we first calculate, the overall variation in the dataset called the Sums of Squares Total.
Eta squared tells you the proportion of total variation that’s accounted for by your specific variable.
The effect of color depends on which manufacturer made the car. That’s called an interaction because the two factors interact with each other.
You could shell out a lot of money for very Instagrammable fancy bottles or save some money and go with a simpler bottle (letting your oil speak for itself).
This time, our TWO factors are expertise and bottle style. Two, hence two-way ANOVA.
When we look at how Experts rate both bottle types, and Novices rate both bottle types, we can see a clear difference, represented by the different slopes of our red and blue lines.
But when you interpret them, you need to do so with caution.
If you DO have gene Y, the medication doesn’t work that well. In fact, you’ll feel about the same. But if you DON’T have gene Y, it works incredibly well all of a sudden your sneezes are gone!
The different slopes for each of our lines in this interaction plot demonstrate how the, two groups respond differently.
Looking at the data you have--seems like you should go with the fancy bottles. The experts won’t be swayed but the rest of your customers will like all the embellishment.
People, cells, animals, and pretty much anything we might be interested in measuring, are parts, of multiple groups. So it’s important to have the tools to consider multiple groups together with a statistical model.
Like your gender and your ethnicity and your pay. Or your age and generation and favorite slurpee flavor.
Transcripts


5.0 / 5 (0 votes)
Thanks for rating: