Finding degrees of freedom, critical values, and a standard deviation confidence interval estimate
TLDRIn this educational video, Professor Curtis from Aspire Mountain Academy guides viewers through calculating degrees of freedom, critical values, and a confidence interval estimate for the population standard deviation. Using a sample size of 25 with a standard deviation of 0.26 and a 99% confidence level, the video demonstrates how to find these statistics using StatCrunch. The process includes using the chi-square distribution for critical values and adjusting for variance to estimate the standard deviation, with a focus on clarity and application.
Takeaways
- 📚 The video is a statistics homework help by Professor Curtis from Aspire Mountain Academy.
- 🔢 The main topic is to find degrees of freedom, critical values, and a confidence interval estimate for the population standard deviation (Sigma).
- 📉 The assumption is that a simple random sample is selected from a normally distributed population.
- 🎯 A 99% confidence level is required for the interval estimate.
- 🔡 The sample size is 25, and the sample standard deviation is 0.26.
- 🔑 Degrees of freedom are calculated as one less than the sample size, which is 24 in this case.
- 📊 To find critical values, the chi-square distribution is used with StatCrunch, a statistical software.
- 📈 The chi-square calculator is accessed for the critical values corresponding to the 99% confidence level.
- 📐 The critical value on the left (subscript L) and the right (subscript R) are obtained from the calculator.
- 🧮 For the confidence interval estimate of the population standard deviation, the sample variance is calculated by squaring the sample standard deviation.
- 📝 The confidence interval for variance is computed in StatCrunch, and then the square root is taken to convert it to the standard deviation interval.
- 🌐 Aspire Mountain Academy offers more resources for learning statistics, and viewers are encouraged to provide feedback.
Q & A
What is the topic of the video by Professor Curtis from Aspire Mountain Academy?
-The video is about how to find degrees of freedom, critical values, and a confidence interval estimate for the population standard deviation in a statistics homework problem.
What is the sample size given in the problem statement?
-The sample size given in the problem statement is 25.
How is the number of degrees of freedom calculated in this context?
-The number of degrees of freedom is calculated as one less than the sample size, which in this case is 24 (25 - 1).
What statistical software does Professor Curtis use to find critical values?
-Professor Curtis uses StatCrunch to find the critical values.
What type of calculator is accessed in StatCrunch to find the critical values for this problem?
-The Chi-square calculator is accessed in StatCrunch to find the critical values.
What is the confidence level required for the interval in this problem?
-The required confidence level for the interval in this problem is 99%.
How does the video explain the relationship between sample standard deviation and sample variance?
-The video explains that the sample variance can be obtained by squaring the sample standard deviation.
What is the method used in StatCrunch to calculate the confidence interval for standard deviation?
-The method used is to first calculate the confidence interval for variance and then take the square root of the variance to get the confidence interval for standard deviation.
What is the purpose of the video's final remarks about Aspire Mountain Academy?
-The final remarks are an invitation for viewers to visit Aspire Mountain Academy's website for more lecture videos and to provide feedback on what they would like to see in future content.
How does the video script suggest improving one's understanding of statistics?
-The video script suggests that if a viewer's stats teacher is not helpful or engaging, they can visit Aspire Mountain Academy for more accessible and helpful lecture videos.
What is the significance of the critical values in the context of this video?
-The critical values are significant as they are used to define the boundaries of the confidence interval for the population standard deviation.
Outlines
📚 Introduction to Degrees of Freedom and Confidence Intervals
Professor Curtis from Aspire Mountain Academy introduces the topic of finding degrees of freedom, critical values, and the confidence interval estimate for the population standard deviation. The problem statement outlines the task of using given information to calculate these values, assuming a simple random sample from a normally distributed population. The professor explains that with a 99% confidence level, a sample size of 25, and a sample standard deviation of 0.26, the degrees of freedom are calculated as 24 (one less than the sample size).
📉 Calculating Critical Values Using StatCrunch
The professor demonstrates how to calculate the critical values required for a 99% confidence interval using StatCrunch. He accesses the chi-square distribution calculator within StatCrunch, inputs the degrees of freedom (24), and the confidence level (99%). The calculator provides two critical values, one for each tail of the distribution. The left critical value is identified as the primary value needed for the next steps, and the professor rounds it to three decimal places for accuracy.
🔍 Confidence Interval Estimate for Population Standard Deviation
To estimate the population standard deviation with a 99% confidence interval, the professor returns to StatCrunch and uses the 'stat variant stats' function, entering the squared sample standard deviation as the sample variance. With the sample size and confidence level set, the calculator provides the interval for the variance. The professor then takes the square root of these values to convert the interval estimate from variance to standard deviation, providing the final lower and upper limits for the confidence interval.
Mindmap
Keywords
💡Degrees of Freedom
💡Critical Values
💡Confidence Interval
💡Population Standard Deviation (Sigma)
💡Sample Size
💡Sample Standard Deviation
💡Chi-Squared Distribution
💡StatCrunch
💡Variance
💡99% Confidence Level
💡Square Root
Highlights
Introduction to finding degrees of freedom, critical values, and confidence interval estimate for standard deviation.
Assumption of a simple random sample from a normally distributed population.
The requirement of a 99% confidence level for the interval.
Sample size of 25 and sample standard deviation of 0.26 provided.
Calculation of degrees of freedom as one less than the sample size.
Use of StatCrunch for finding critical values.
Accessing the chi-square distribution in StatCrunch for critical value calculation.
Entering the degrees of freedom and confidence level into StatCrunch.
Obtaining the critical values for the chi-square distribution.
Calculation of the left critical value for the confidence interval.
Calculation of the right critical value for the confidence interval.
Using StatCrunch to calculate the confidence interval for the population standard deviation.
Understanding that variance is the square of the standard deviation.
Entering the squared sample standard deviation as the sample variance in StatCrunch.
Setting up the confidence interval calculation in StatCrunch.
Computing the lower and upper limits of the confidence interval for variance.
Converting the confidence interval from variance to standard deviation by taking the square root.
Finalizing the confidence interval estimate for the population standard deviation.
Encouragement for feedback and further learning through Aspire Mountain Academy.
Transcripts
Browse More Related Video
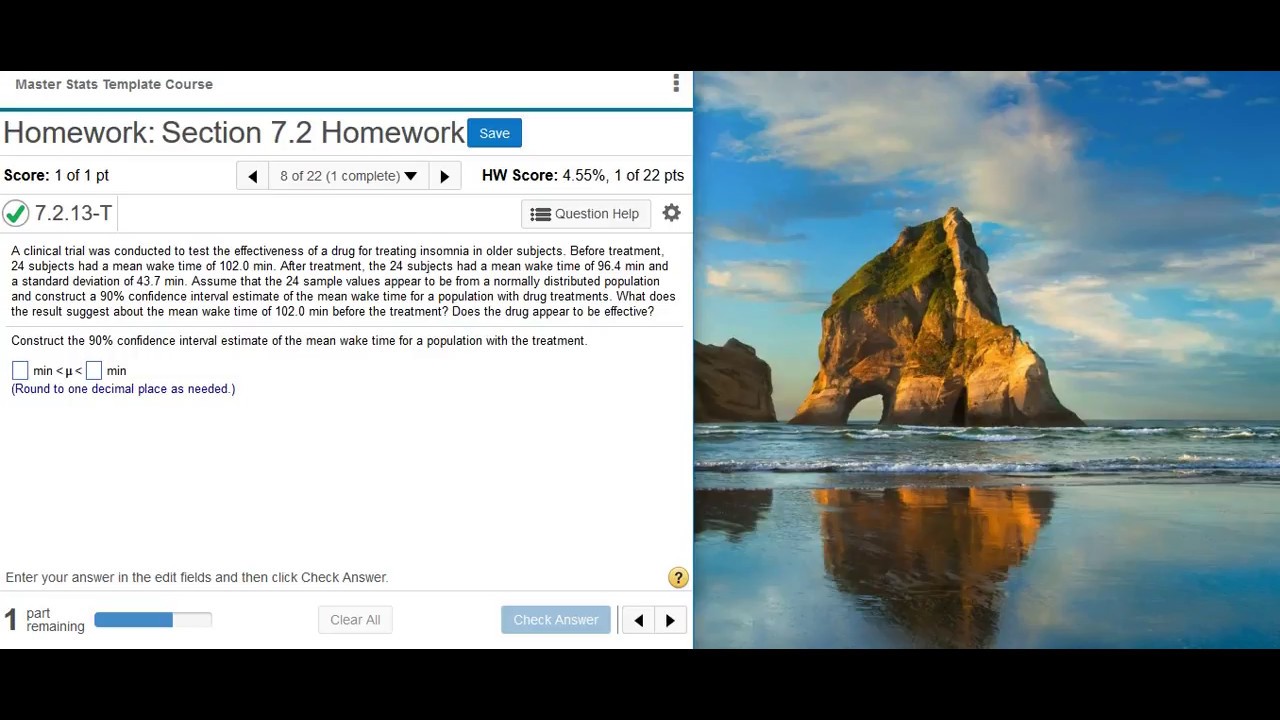
Finding and interpreting a confidence interval for a population mean (σ unknown)
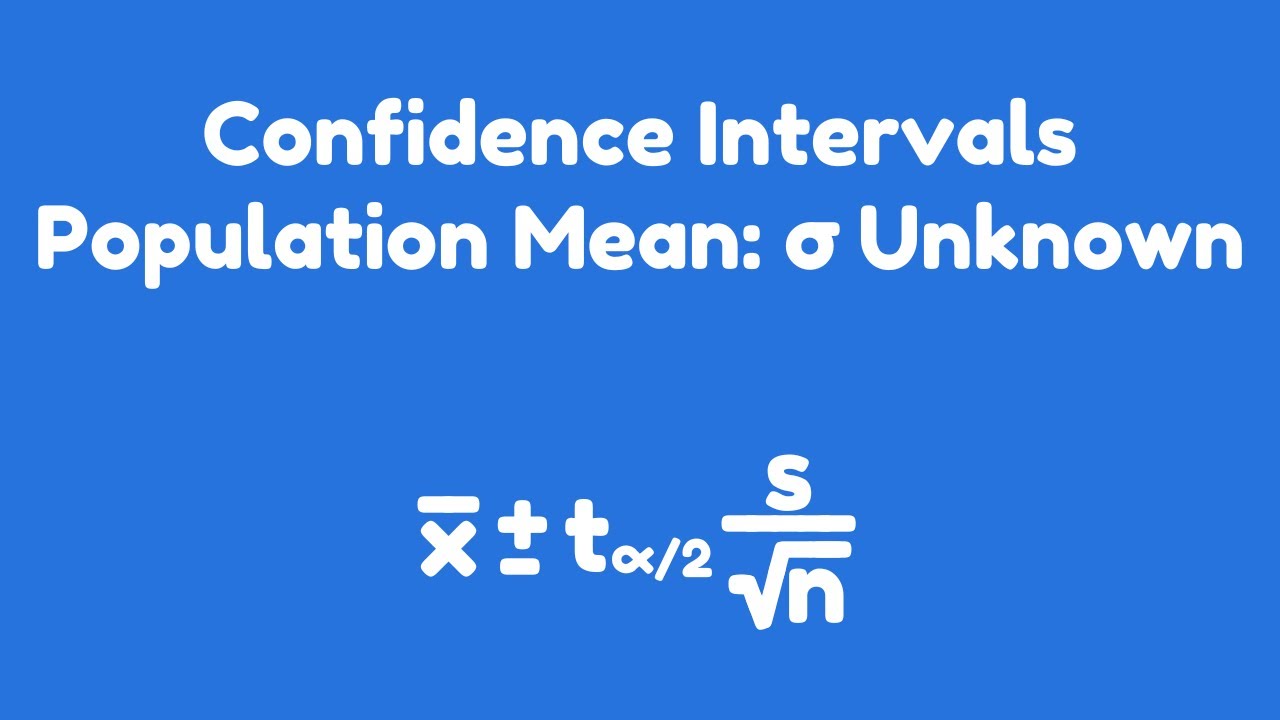
Confidence Intervals | Population Mean: σ Unknown
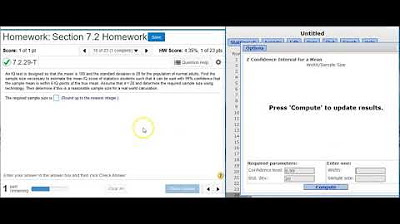
Finding the sample size needed to estimate a confidence interval on a population mean
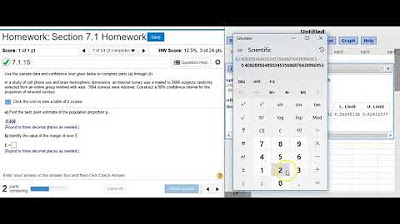
Finding the best point estimate and confidence interval for proportions
7.1.3 Estimating a Population Proportion - Critical Values, Rationale and How to Compute Them

[6.4.6-T] Finding probabilities for different sample sizes using a nonstandard normal distribution
5.0 / 5 (0 votes)
Thanks for rating: