What is a Confidence Interval? | Puppet Master of Statistics
TLDRIn this educational video, Mike Merin explains the concept of a confidence interval for estimating a population mean. He illustrates the importance of not relying solely on a sample mean due to sampling variability, and introduces the idea of a margin of error to create a confidence interval. Using the example of estimating the mean length of fish in a lake, he demonstrates how to calculate a 95% confidence interval and acknowledges the inherent uncertainty in statistical estimation. The video also hints at the application of confidence intervals to other statistical summaries and the testing of hypotheses.
Takeaways
- 🔍 The concept of a confidence interval is used to estimate a population mean from a sample, acknowledging that there will be some sampling variability.
- 🧐 A single sample mean is not enough to estimate the population mean accurately due to the possibility of variation in different samples.
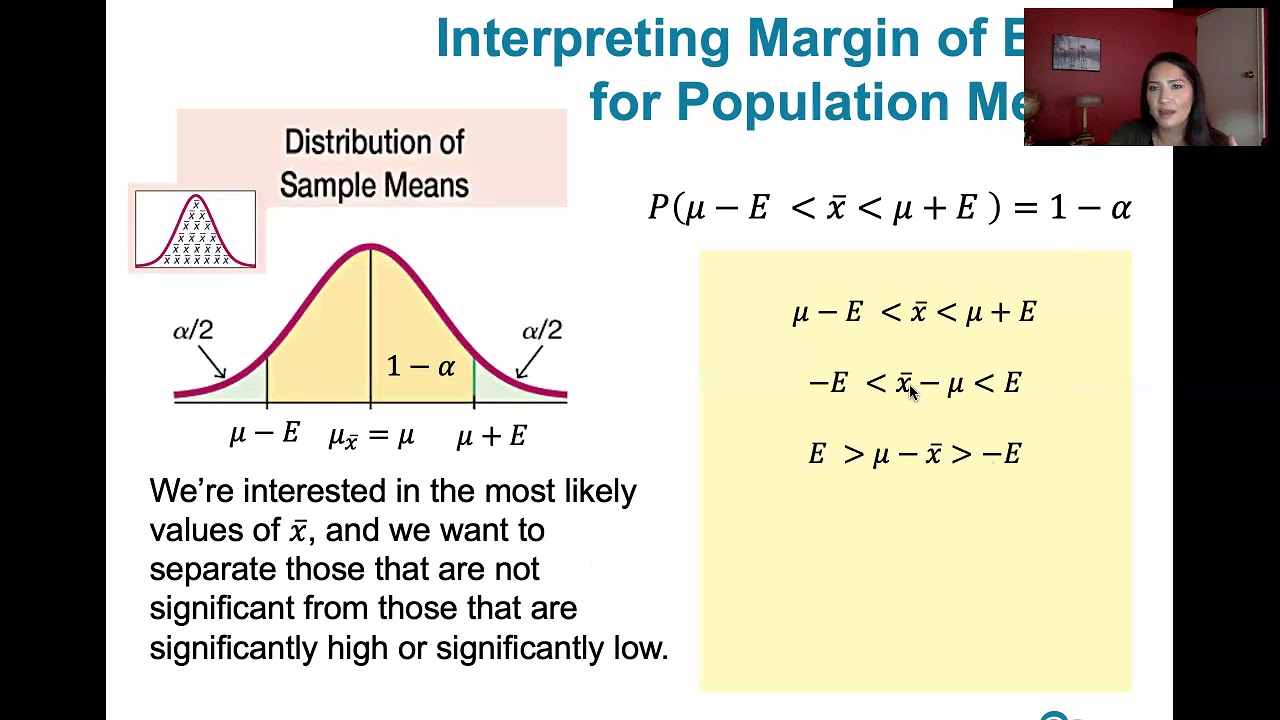
- 📊 A confidence interval provides a range with a margin of error, indicating the level of confidence that the true population mean falls within this range.
- 🎯 The sampling distribution of the mean is a theoretical set of all possible sample means, which helps in understanding the variability of sample means.
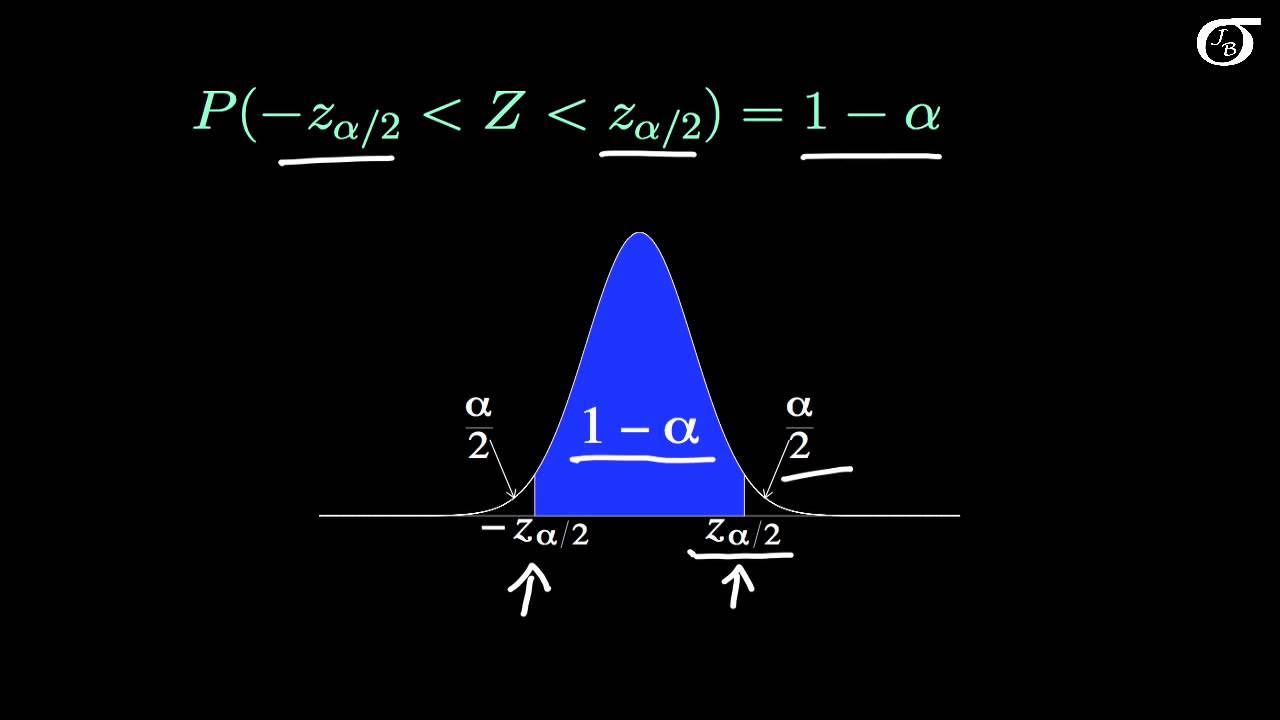
- 📚 A common rule of thumb is that about 95% of sample means will fall within two standard errors of the true mean, under certain conditions.
- 📉 The true mean is usually within two standard errors of the sample mean, but there's a 5% chance that it might not be, due to sampling variability.
- 📝 The margin of error is calculated by extending two standard errors from the sample mean, creating a confidence interval that is likely to contain the population mean.
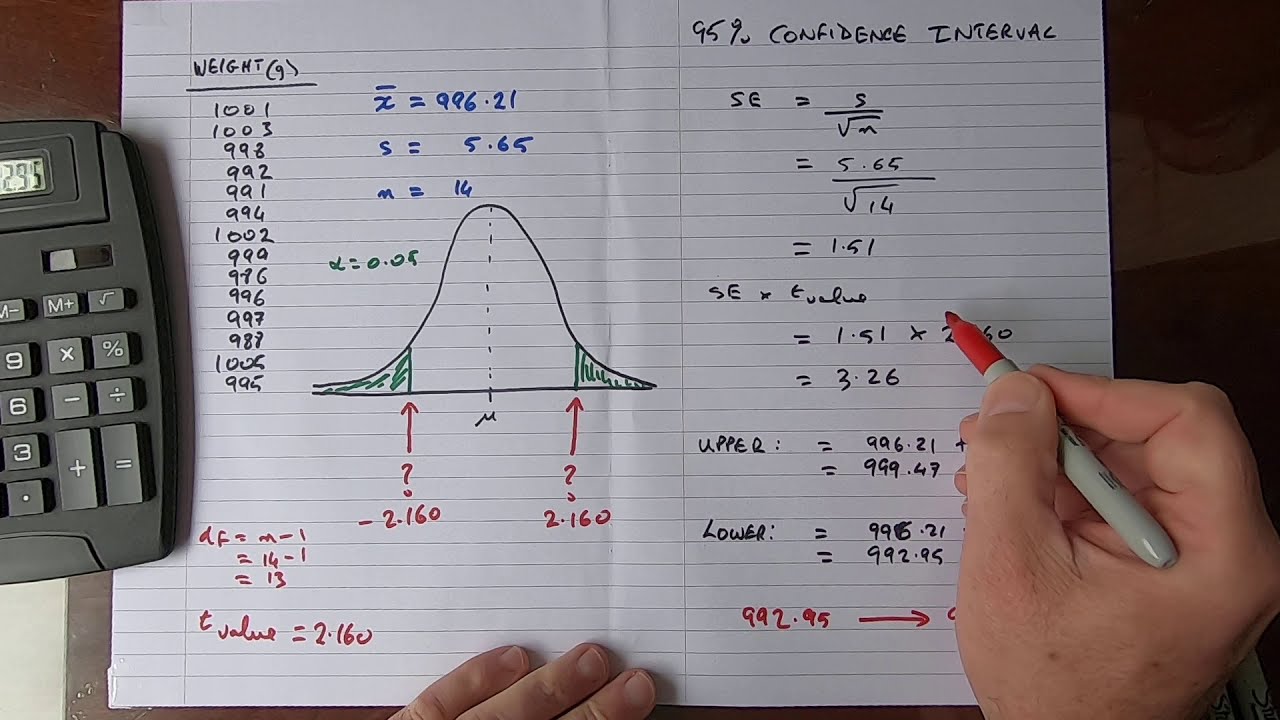
- 🐟 An example given in the script is estimating the mean length of fish in a lake, where a sample mean of 41 cm with a standard deviation of 12 cm leads to a 95% confidence interval of 36.2 to 45.8 cm.
- 📉 The width of the confidence interval is affected by the sample size; larger sample sizes result in smaller standard errors and narrower intervals.
- 🔬 Confidence intervals can also be constructed for estimates that summarize relationships between variables, such as differences in means or correlations.
- 👨🏫 The script suggests that further discussion on using the sampling distribution to test hypotheses about a population mean will be provided in a separate video.
Q & A
What is the main topic discussed by Mike Merin in the video?
-The main topic discussed is the concept of a confidence interval for estimating a population mean in research.
Why might relying solely on the sample mean be problematic?
-Relying solely on the sample mean is problematic because it does not account for the sampling variability, which means that different samples taken at different times could yield different results.
What is the purpose of a confidence interval in statistics?
-The purpose of a confidence interval is to provide a range of values that, with a certain level of confidence, is likely to contain the true population mean, accounting for sampling variability.
What is the theoretical basis for the creation of a confidence interval?
-The theoretical basis for creating a confidence interval is the sampling distribution of the mean, which describes the distribution of all possible sample means that could be obtained from a population.
What is the rule of thumb mentioned in the video for estimating the confidence interval?
-The rule of thumb mentioned is that about 95% of all sample means will be less than two standard errors away from the true mean, which is used to estimate the margin of error for a 95% confidence interval.
Why is it important to understand that not all confidence intervals will capture the true mean?
-It is important to understand this because it acknowledges the inherent uncertainty in statistical estimation. Even with a 95% confidence interval, there is still a 5% chance that the true mean is not captured, reflecting the limits of statistical inference.
How does the sample size affect the width of the confidence interval?
-The width of the confidence interval is affected by the sample size because the standard error, which determines the margin of error, decreases as the sample size increases, resulting in a narrower and more precise confidence interval.
Can confidence intervals be constructed for other statistical estimates besides the mean?
-Yes, confidence intervals can also be constructed for other statistical estimates such as differences in means or correlations, based on the same concepts and principles.
What is the relationship between the sample mean and the true mean in the context of a confidence interval?
-In the context of a confidence interval, the sample mean is the best estimate of the true mean, but the true mean is usually less than two standard errors away from the sample mean, which is used to define the interval within which the true mean is likely to fall.
What is the significance of the margin of error in a confidence interval?
-The margin of error in a confidence interval signifies the range within which the true population mean is expected to fall, given the sample data and the level of confidence. It reflects the precision of the estimate and the impact of sampling variability.
Outlines
📊 Understanding Confidence Intervals for Population Mean
In this paragraph, Mike Merin introduces the concept of a confidence interval for estimating a population mean from a sample. He explains the limitations of relying solely on the sample mean due to sampling variability and how a confidence interval, with a margin of error, can account for this variability. The idea is illustrated with an example of estimating the mean length of fish in a lake, where the true population mean is known to be 40 cm. The paragraph also discusses the rule of thumb that about 95% of sample means fall within two standard errors of the true mean, creating a 95% confidence interval. The concept of the sampling distribution is highlighted as crucial for attaching a margin of error to the estimate, leading to the creation of a confidence interval.
🔍 Further Exploration of Confidence Intervals and Hypothesis Testing
The second paragraph briefly mentions that the principles discussed for constructing confidence intervals can also be applied to other statistical estimates, such as differences in means or correlations. It also hints at a future video that will delve into how the sampling distribution can be utilized to test hypotheses about a population mean. The paragraph concludes with a reminder to check out accompanying statistics visualizations and a casual, personal anecdote that seems unrelated to the main topic.
Mindmap
Keywords
💡Confidence Interval
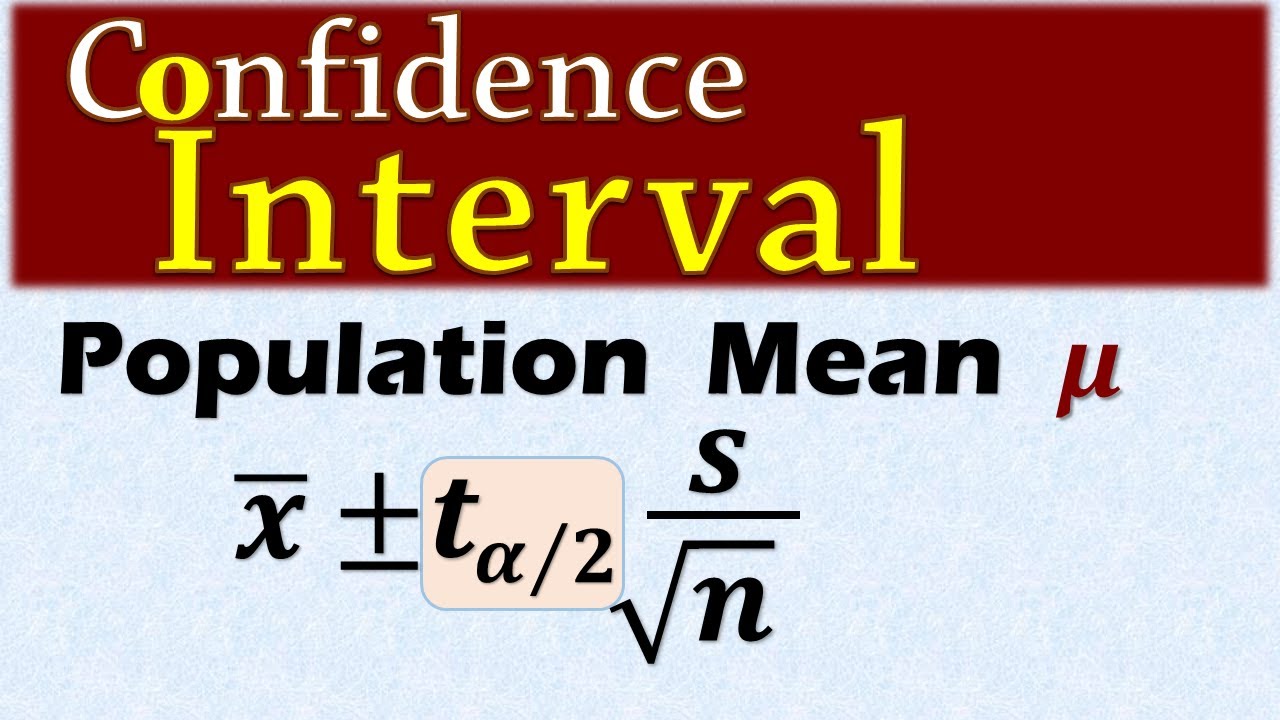
💡Population Mean
💡Sample Mean
💡Sampling Variability
💡Margin of Error
💡Standard Error
💡Sampling Distribution
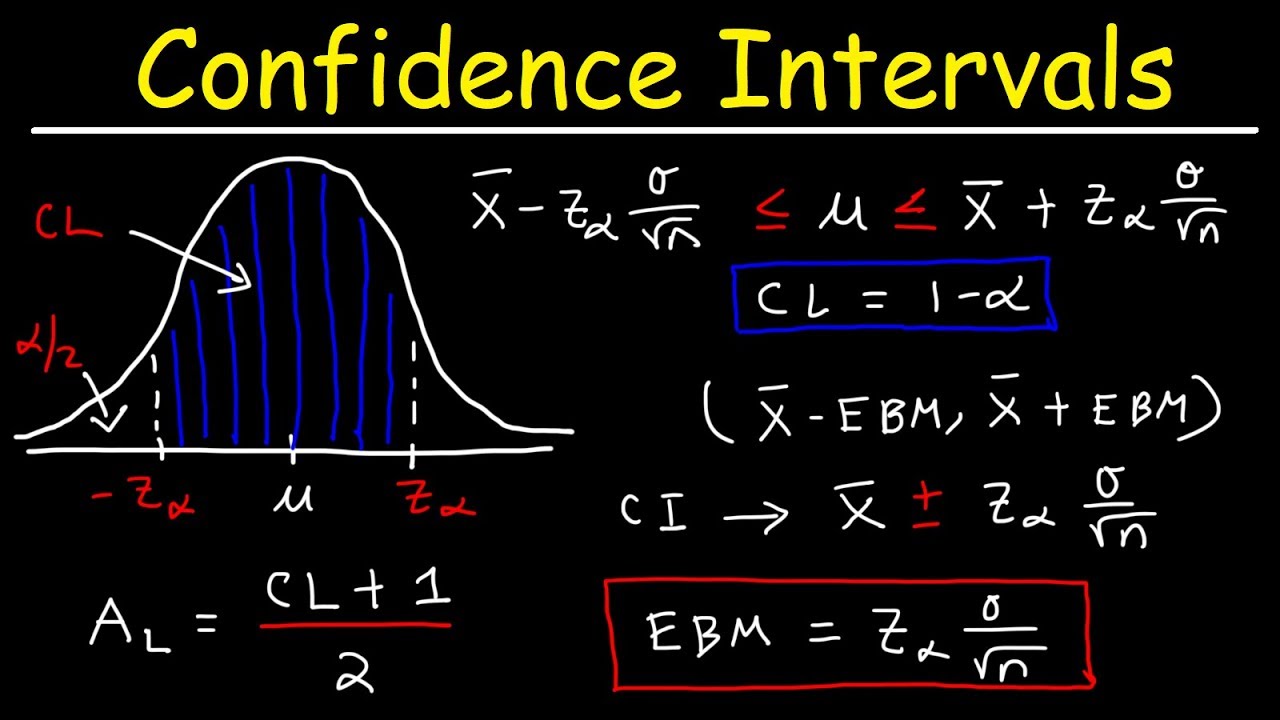
💡95% Confidence Level
💡Standard Deviation
💡Hypothesis Testing
💡Statistical Estimation
Highlights
The concept of a confidence interval for a population mean is discussed.
A sample is used to estimate the population mean, but relying solely on the sample mean can be problematic due to sampling variability.
A margin of error is attached to the estimate to account for differences between samples.
The sampling distribution describes the theoretical set of all possible estimates.
A rule of thumb states that about 95% of sample means will be within two standard errors of the true mean.
The true mean is usually within two standard errors of the sample mean, allowing for a confidence interval to be created.
5% of sample means will be more than two standard errors away from the true mean, not capturing it within the confidence interval.
The standard error and confidence interval width depend on the sample size, becoming smaller and more precise with larger sample sizes.
An example is given estimating the mean length of fish in a lake, with a 95% confidence interval calculated.
Confidence intervals can also be constructed for estimates summarizing relationships between variables.
The sampling distribution is used to test hypotheses about a population mean in a separate video.
The video includes statistics visualizations to accompany the concepts discussed.
The importance of accepting the limitations of statistical estimates is emphasized.
The video explains the process of creating a confidence interval using a sample mean and standard error.
The impact of sampling variability on the accuracy of population mean estimates is highlighted.
The video provides a practical application of confidence intervals in estimating the mean length of fish.
The role of the sample size in determining the precision of the confidence interval is explained.
Transcripts
Browse More Related Video

What is a Hypothesis Test and a P-Value? | Puppet Master of Statistics
7.2.2 Estimating a Population Mean - Sample Mean, Margin of Error, and Finding Confidence Intervals
How To...Calculate the Confidence Interval for a Sample
Confidence Interval for a population mean - t distribution
How To Find The Z Score, Confidence Interval, and Margin of Error for a Population Mean
Deriving a Confidence Interval for the Mean (The Rationale Behind the Confidence Interval Formula)
5.0 / 5 (0 votes)
Thanks for rating: