How to Read a T-Table and Z-Table
TLDRThis educational video script offers a clear guide on interpreting z-tables and t-tables for statistical analysis. It emphasizes the z-table's intuitiveness, explaining how to find probabilities associated with z-scores and critical values. The script then contrasts this with the t-table, which involves degrees of freedom and requires comparing calculated t-scores to critical values for hypothesis testing. The explanation includes finding confidence intervals and understanding one-tailed versus two-tailed tests, aiming to clarify common confusions and enhance statistical literacy.
Takeaways
- 📚 The video is a tutorial on how to read Z-tables and T-tables in statistics.
- 🔍 The presenter finds Z-tables more intuitive than T-tables due to their simpler structure without degrees of freedom.
- 🎯 Z-tables directly associate critical values with probabilities and vice versa.
- 📊 To read a Z-score in the table, locate the score on the table and find the intersecting probability.
- 🔢 For a Z-score of 1.32, the probability is approximately 0.9066.
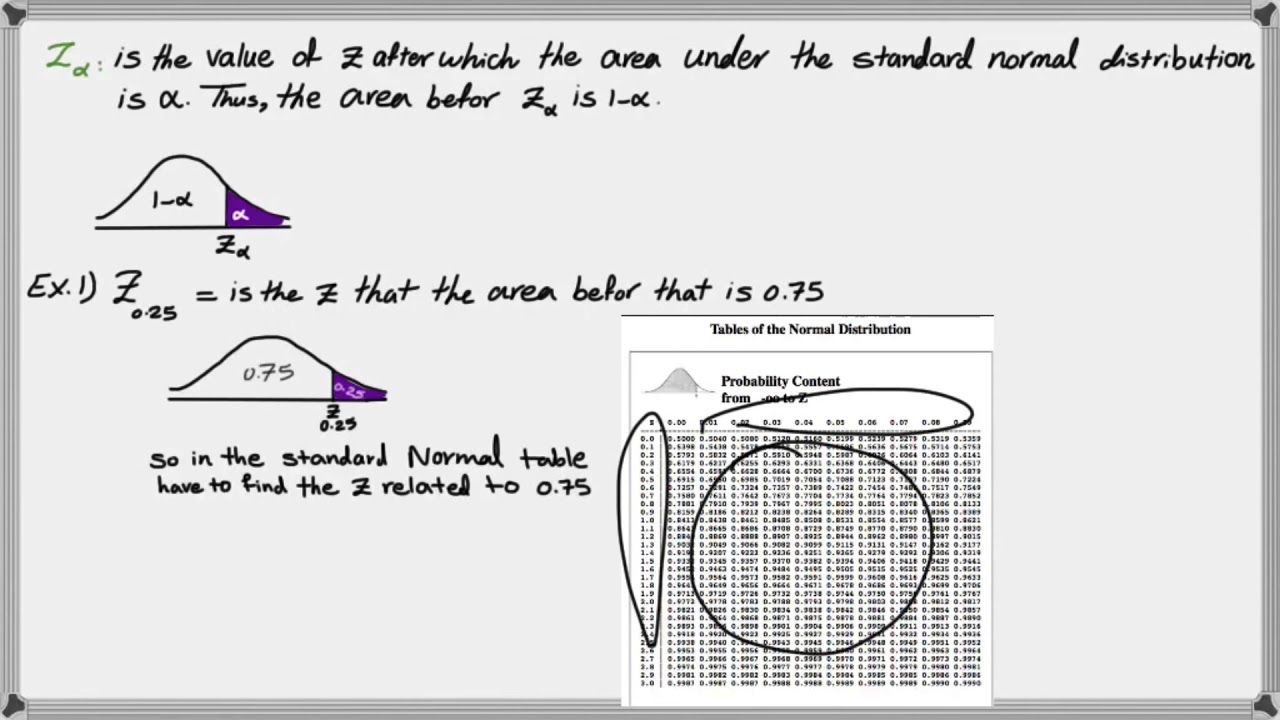
- 🔍 To find the critical value for a given probability, locate the probability in the table and identify the corresponding Z-score.
- 🌐 Understanding the symmetry of the normal distribution helps in finding the reverse probability by using one minus the given probability.
- 📉 For a 95% confidence interval, the critical Z-value is approximately 1.645, found by averaging the values at 0.9495 and 0.9505.
- ➡️ The negative of a Z-score represents the lower tail of the distribution, useful for one-tailed confidence intervals.
- 📈 T-tables are more complex due to the inclusion of degrees of freedom and are used to find critical values for hypothesis testing.
- 🔑 T-tables do not directly provide probabilities; they are used to compare calculated t-scores with critical values for significance testing.
- 📚 The presenter suggests that understanding Z-tables can make learning T-tables easier, despite the common teaching order being the reverse.
Q & A
What are the two main types of statistical tables discussed in the script?
-The script discusses how to read a Z-table and a T-table, which are used for normal distribution and t-distribution respectively.
Why does the speaker find the Z-table more intuitive than the T-table?
-The speaker finds the Z-table more intuitive because it does not involve degrees of freedom and directly associates critical values with probabilities.
What is a Z-score and how is it used in the context of the script?
-A Z-score is a standard score that indicates how many standard deviations an element is from the mean. In the script, a Z-score of 1.32 is used to demonstrate how to read probabilities from the Z-table.
How does the script explain finding the probability associated with a Z-score?
-The script explains that you look at the table to find the closest Z-score value, and then find the corresponding probability to the left of that value, as the table is reflective of the area to the left of the critical value.
What is the probability associated with a Z-score of 1.32 according to the script?
-The probability associated with a Z-score of 1.32 is approximately 0.9066, as explained in the script.
How does the script describe finding the critical value for a given probability?
-The script describes finding the critical value by looking through the probabilities in the table and identifying the value that corresponds to the desired probability, such as 0.9495 and 0.9505 for a 95% probability.
What critical value is commonly used for a 95% probability in the Z-table?
-The critical value commonly used for a 95% probability is 1.645, which is the average of the two probabilities 0.9495 and 0.9505.
How does the script explain the concept of a one-tailed and two-tailed test in the context of the T-table?
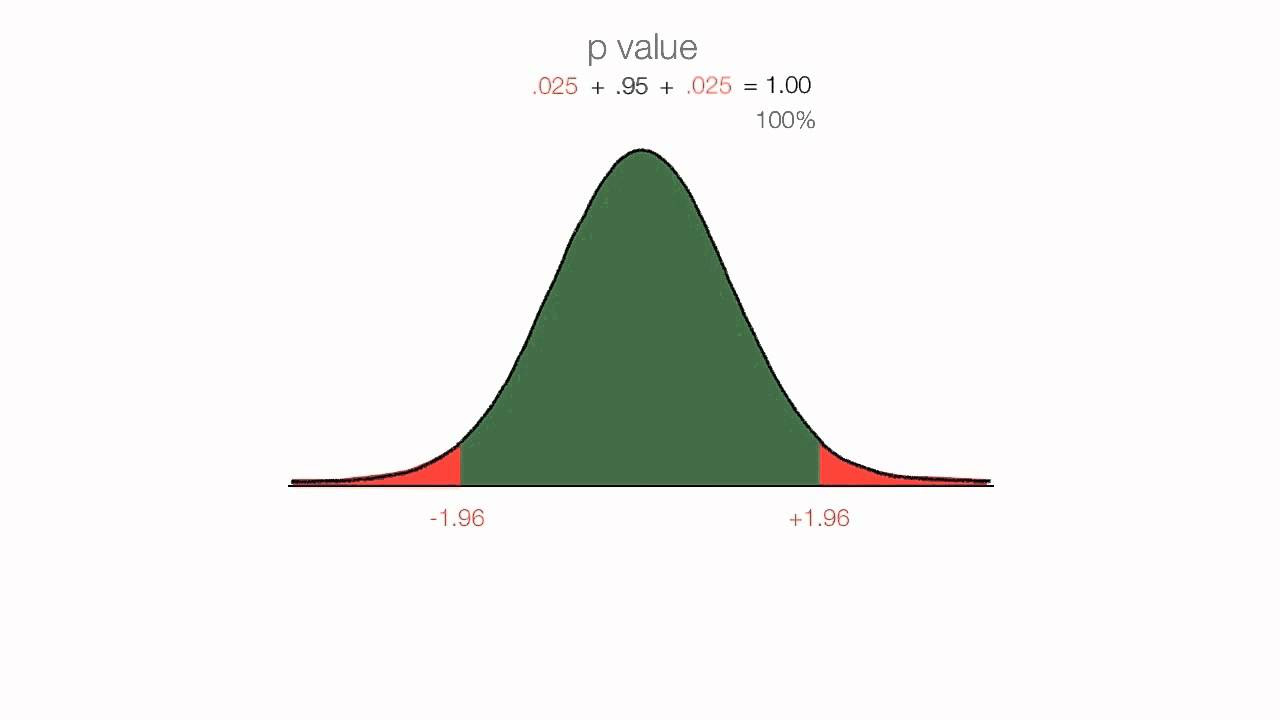
-The script explains that a one-tailed test focuses on one side of the distribution (either greater than or less than), while a two-tailed test considers both sides. The critical value for a one-tailed test is found by looking at the 0.025 level, whereas for a two-tailed test, it's the middle 95%.
What is the difference between using the Z-table and the T-table when calculating a confidence interval?
-The Z-table directly provides probabilities, making it easier to calculate confidence intervals, while the T-table provides critical values that need to be compared with calculated t-scores, and probabilities are not directly available without additional tools or software.
How does the script suggest finding the negative critical value for a confidence interval?
-The script suggests that to find the negative critical value, you simply put a negative sign in front of the positive critical value because the normal distribution is symmetrical.
What does the script imply about the importance of understanding the symmetry of the normal distribution when using the Z-table?
-The script implies that understanding the symmetry of the normal distribution is crucial when using the Z-table because it allows you to easily find the corresponding probability for the negative side of the distribution by using the one minus the positive probability.
Outlines
📊 Understanding Z-Tables for Probabilities
This paragraph introduces the concept of reading a Z-table to determine probabilities associated with a given Z-score. The speaker explains that Z-tables are more intuitive than T-tables due to their straightforward critical values and lack of degrees of freedom. The process of finding the probability for a Z-score of 1.32 is demonstrated, showing how to locate the score on the table and interpret the resulting probability of 0.9066. Additionally, the paragraph covers how to find the critical value for a specific probability, using the example of a 95% probability with a critical value of 1.645. The importance of symmetry in the normal distribution is highlighted, and the concept of negative Z-scores is briefly introduced.
🔍 Transitioning from Z-Tables to T-Tables
The second paragraph discusses the transition from Z-tables to T-tables, emphasizing the additional complexity of T-tables due to the inclusion of degrees of freedom. The speaker clarifies that T-tables are used to find critical values rather than direct probabilities, which often require the use of software or online calculators. The paragraph explains how to interpret T-tables for both one-tailed and two-tailed tests, using the example of a T-table with 2 degrees of freedom and a 95% probability, which corresponds to a critical value of 4.303 for a two-tailed test and 2.92 for a one-tailed test. The speaker also shares personal insights on the learning process, suggesting that starting with Z-tables before moving to T-tables can be less confusing for beginners. The paragraph concludes with an invitation for feedback and a parting message encouraging viewers to stay curious.
Mindmap
Keywords
💡Z Table
💡Critical Value
💡Probability
💡Degrees of Freedom
💡T Table
💡Normal Distribution
💡Confidence Interval
💡Hypothesis Test
💡P-Value
💡Symmetric
💡One-Tailed and Two-Tailed Tests
Highlights
Introduction to reading a Z table and a T table for statistical analysis.
Z table is considered more intuitive due to the absence of degrees of freedom.
Explanation of associating critical values with probabilities in Z tables.
Demonstration of how to read a Z-score of 1.32 on the table.
Understanding the symmetry of the normal distribution for probability calculations.
Finding the critical value for a 95% probability using the Z table.
Calculating the negative Z-score for a 90% confidence interval.
Differences between Z and T tables, particularly the inclusion of degrees of freedom in T tables.
The process of finding a critical value in T tables for a given probability.
Using software to find probabilities in T tables due to their complexity.
Explanation of comparing calculated t-scores with critical t-values in hypothesis testing.
Differentiating between one-tailed and two-tailed tests in hypothesis testing.
Finding the critical t-value for a specific degree of freedom and probability.
The importance of hypothesis in determining whether to use one-tailed or two-tailed tests.
Teaching preference and the transition from Z to T tables in learning statistics.
Invitation for feedback on the video to improve future content.
Closing remarks encouraging viewers to stay engaged with the material.
Transcripts


5.0 / 5 (0 votes)
Thanks for rating: