Elementary Statistics - Chapter 8 - Hypothesis Testing Part 3 Revised
TLDRThis script offers an in-depth review of hypothesis testing, focusing on the nature of tests, types of hypotheses, and the rejection region determined by the alternative statement. It explains the t-test for a mean when the population standard deviation is unknown, detailing the process of finding critical values and test statistics using alpha levels and degrees of freedom. The script also covers how to use calculators and tables for hypothesis testing, including examples of left-tail, right-tail, and two-tailed tests, ultimately guiding users on how to interpret results and make decisions based on statistical evidence.
Takeaways
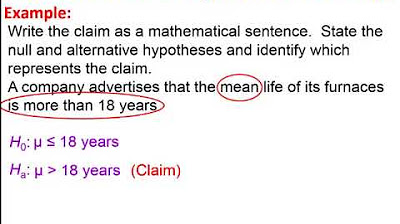
- 📚 Hypothesis testing involves evaluating statistical claims using a null hypothesis (H0) and an alternative hypothesis (H1).
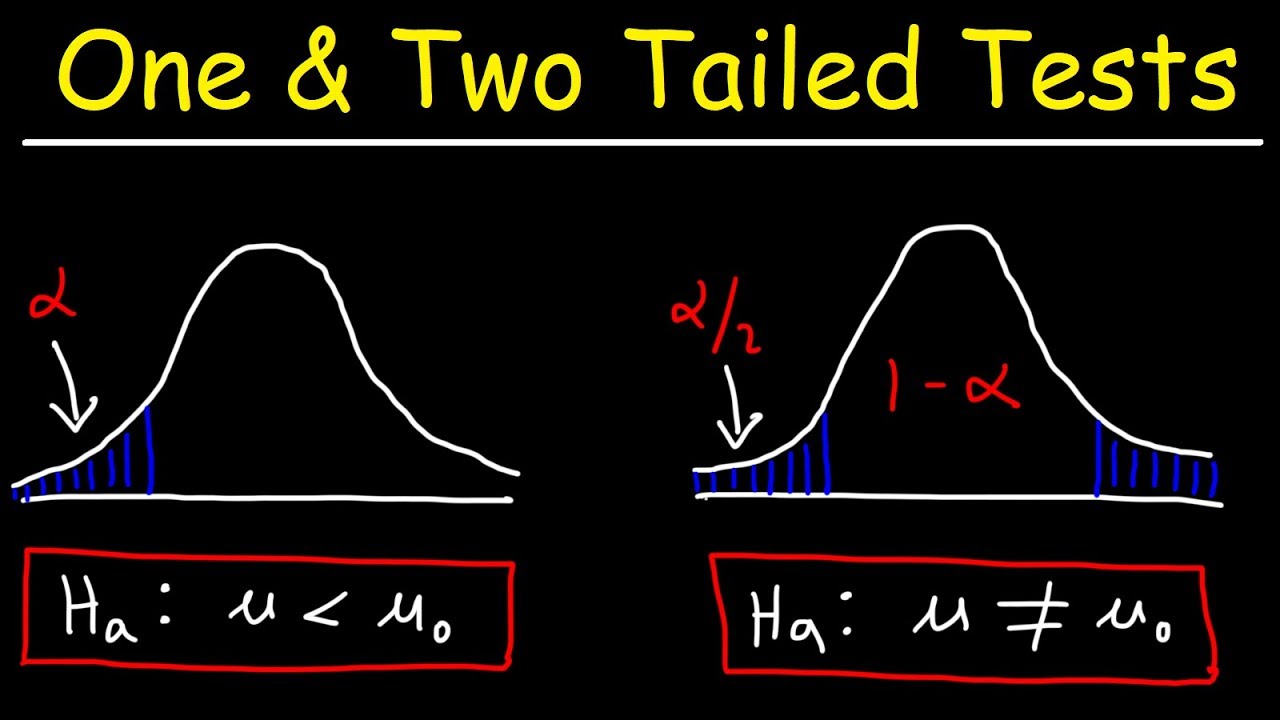
- 📉 In a left-tail test, the rejection region is to the left of the critical value, indicated by the alternative hypothesis with a 'less than' symbol.
- 📈 Right-tail tests have a rejection region to the right of the critical value, corresponding to an alternative hypothesis with a 'greater than' symbol.
- 🔍 The two-tailed test considers rejection regions on both sides of the distribution, used when the alternative hypothesis is 'not equal to'.
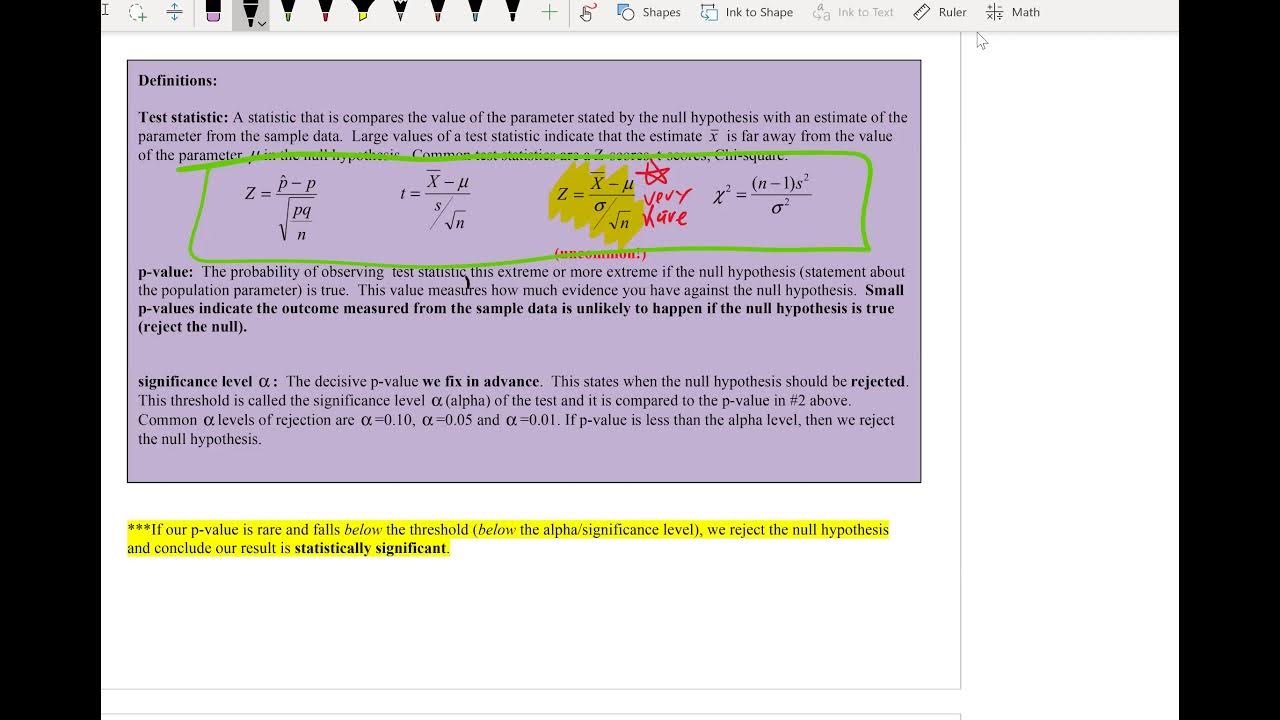
- 🎯 The critical value is determined by the level of significance (alpha), which is the probability of rejecting the null hypothesis when it is true.
- ⚖️ The t-test is used for hypothesis testing of a mean when the population standard deviation is unknown, applicable for normally distributed populations or samples larger than 30.
- 📊 To find the critical value for a t-test, identify alpha, calculate degrees of freedom (sample size - 1), and use a t-distribution table or calculator.
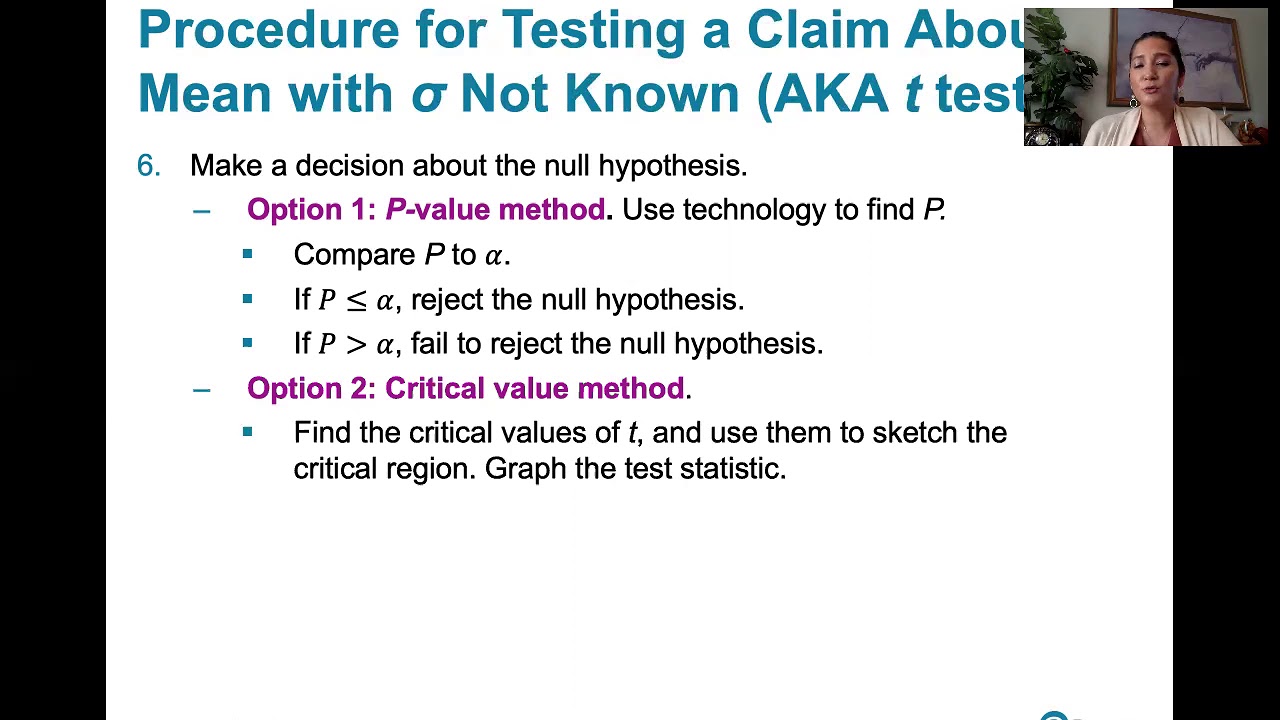
- 📘 The standardized test statistic (t-value) is compared against the critical value to decide whether to reject or fail to reject the null hypothesis.
- 🔢 For a t-test, the test statistic is calculated using the formula involving the sample mean, population mean, sample standard deviation, and sample size.
- 📝 When using a calculator for t-test, input the necessary values including mean, standard deviation, sample size, and select the correct alternative hypothesis.
- 🌐 The process of hypothesis testing for proportions involves the z-test, which requires conditions based on the binomial distribution to be met.
Q & A
What are the three types of hypotheses in hypothesis testing?
-The three types of hypotheses in hypothesis testing are the null hypothesis (H0), the alternative hypothesis (H1 or Ha), and sometimes the research hypothesis. The null hypothesis typically represents the status quo or a statement of no effect, while the alternative hypothesis represents the claim or research question being tested.
What is the significance of the rejection region in hypothesis testing?
-The rejection region is the area under the probability distribution curve that defines the range of values for which the null hypothesis will be rejected. It is determined based on the critical value and the level of significance (alpha), and it indicates the threshold for statistical significance.
What is the difference between a left-tail test and a right-tail test in terms of the alternative hypothesis and the rejection region?
-A left-tail test has an alternative hypothesis with a less than symbol (<), and the rejection region is the shaded area to the left of the critical value. A right-tail test has an alternative hypothesis with a greater than symbol (>), and the rejection region is the shaded area to the right of the critical value.
What is the purpose of the critical value in hypothesis testing?
-The critical value is the threshold value determined by the level of significance (alpha) that separates the rejection and non-rejection regions. If the test statistic falls into the rejection region, the null hypothesis is rejected based on the critical value.
When is the t-test for a mean used in hypothesis testing?
-The t-test for a mean is used in hypothesis testing when the population standard deviation is unknown and the population is normally distributed or the sample size is greater than or equal to 30.
What is the formula used to calculate the standardized test statistic in a t-test for a mean?
-The formula for the standardized test statistic (t) in a t-test for a mean is t = (Sample Mean - Population Mean) / (Sample Standard Deviation / √Sample Size).
How do you determine the critical value for a t-test using a calculator?
-To determine the critical value for a t-test using a calculator, you would typically use the inverse T function, entering the level of significance (alpha) and the degrees of freedom, and then pressing enter to obtain the critical value.
What is the difference between a one-tailed test and a two-tailed test in terms of the rejection region?
-A one-tailed test has a rejection region on either the extreme left or right side of the distribution curve, depending on whether the alternative hypothesis is less than or greater than, respectively. A two-tailed test has rejection regions on both tails of the distribution, and the test statistic can reject the null hypothesis if it falls into either of the two shaded regions.
What is the role of the sample size in determining the degrees of freedom in a t-test?
-The degrees of freedom in a t-test is determined by the sample size minus one (n - 1). It is used to find the critical value from the t-distribution table or calculator, which in turn is used to determine the rejection region.
How do you interpret the results of a hypothesis test in the context of the original claim?
-After conducting the hypothesis test, if the test statistic falls into the rejection region, you reject the null hypothesis, which means there is enough evidence to support the alternative hypothesis and the original claim. If the test statistic does not fall into the rejection region, you fail to reject the null hypothesis, indicating there is not enough evidence to support the claim.
Outlines
📚 Hypothesis Testing Review
This paragraph reviews the basics of hypothesis testing, explaining the nature of tests, types of hypotheses, and the concept of rejection regions based on the alternative hypothesis. It delves into left-tail, right-tail, and two-tailed tests, highlighting the role of the critical value derived from the level of significance (alpha). The paragraph also introduces the t-test for a mean when the population standard deviation is unknown, discussing its conditions of use and the formula for the standardized test statistic.
📉 T-test Calculation and Rejection Regions
The paragraph focuses on calculating the t-test for a mean, emphasizing the process of finding the critical value based on the level of significance and degrees of freedom. It explains how to use a calculator or table to find critical values for left-tailed, right-tailed, and two-tailed tests. The summary also covers how to determine the test statistic using a formula that includes the sample mean, population mean, sample standard deviation, and sample size. The TI-83/84 calculator's process for finding the standardized test statistic is outlined, along with examples of how to interpret the results for hypothesis testing.
🔍 Hypothesis Testing for Mean Prices
This section applies hypothesis testing to determine if there is enough evidence to reject a used-car dealer's claim about the mean price of a 2008 Honda CRV. It guides through writing the hypothesis statements, identifying the level of significance (alpha), finding the critical value, calculating the test statistic, and determining the rejection region. The example concludes with the interpretation of the test results in the context of the original claim.
🌐 Testing pH Level Claims with Hypothesis Testing
The paragraph demonstrates how to use hypothesis testing to evaluate an industrial company's claim about the pH level of water in a nearby river. It involves writing the hypothesis statements, identifying the significance level (alpha), determining the degrees of freedom, finding critical values for a two-tailed test, calculating the test statistic, and comparing it to the rejection region. The outcome is interpreted to decide whether there is enough evidence to reject the company's claim.
📊 Hypothesis Testing with Given Data
This section illustrates how to perform hypothesis testing using a list of data, such as lead concentrations in traditional medicines. It explains the process of identifying the hypothesis statements, finding the critical value at a 0.05 significance level, calculating the test statistic using the data list in a calculator, and comparing it to the critical value to determine if the null hypothesis should be rejected or not.
📈 Z-test for Proportions in Hypothesis Testing
The paragraph introduces the Z-test for proportions, a method used when the binomial distribution condition is met. It explains the formula for the standardized test statistic (Z value) and how to find the critical value (Z sub-alpha) using a calculator or table. The process includes identifying the hypothesis statement, determining the level of significance (alpha), and using the calculator to find the test statistic by comparing it to the critical value to decide whether to reject the null hypothesis.
📝 Hypothesis Testing for Research Claims
This section describes how to apply hypothesis testing to research claims, using examples of cell phone usage and internet access. It outlines the steps to write hypothesis statements, identify the level of significance (alpha), find critical values, calculate the test statistic, and interpret the results to support or reject the claim. The importance of using the correct wording in the decision statement based on the hypothesis test outcome is emphasized.
🔢 Calculation of Test Statistic in Hypothesis Testing
The paragraph focuses on the calculation of the test statistic in hypothesis testing, particularly for proportions. It explains how to use a calculator to find the test statistic (Z value) by entering the sample percentage, sample size, and population proportion. The process includes identifying the hypothesis statement, calculating the number of successes (x value), and comparing the test statistic to the critical value to make a decision about the claim.
📉 Decision Making in Hypothesis Testing
This section emphasizes the importance of proper decision making in hypothesis testing, with examples of claims about college graduates' views on the value of a college degree. It explains how to write hypothesis statements, determine the critical values for a two-tailed test, calculate the test statistic, and compare it to the critical values to decide whether to reject the null hypothesis. The summary highlights the correct interpretation of the test results in the context of the original claim.
📊 Hypothesis Testing Outcomes and Evidence
The final paragraph discusses the outcomes of hypothesis testing and the evidence required to reject or support a claim. It provides examples of hypothesis statements with claims on both the null and alternative hypotheses, explains how to find critical values, calculate test statistics, and interpret the results to make informed decisions. The summary underscores the need for accurate statement formulation and evidence evaluation in hypothesis testing.
Mindmap
Keywords
💡Hypothesis Testing
💡Null Hypothesis (H0)
💡Alternative Hypothesis (H1 or Ha)
💡Critical Value
💡Significance Level (Alpha)
💡Test Statistic
💡T-Test
💡Degrees of Freedom
💡Rejection Region
💡P-Value
💡Z-Test
Highlights
Review of hypothesis testing fundamentals including the nature of tests and types of hypotheses.
Explanation of the rejection region based on the alternative hypothesis for left-tail, right-tail, and two-tailed tests.
Critical value determination based on the level of significance (alpha).
Use of the t-test for a mean when the population standard deviation is unknown.
Conditions for using the t-test, including normal distribution or sample size greater than or equal to 30.
Formula for the standardized test statistic used in t-tests.
Finding critical values using a T-distribution table or calculator.
Procedure for identifying alpha, degree of freedom, and critical value in hypothesis testing.
Use of the TI-84 calculator for finding critical values and test statistics.
Interpretation of test results in the context of the original claim.
Example of hypothesis testing with a used-car dealer's claim about the mean price of a 2008 Honda CRV.
Process of hypothesis testing for proportions using the Z-test.
Conditions for using the Z-test for population proportions, including sample size and success/failure rates.
Formula for calculating the standardized test statistic Z in proportion testing.
Finding critical values for Z-tests using calculators or tables.
Example of testing a claim about the percentage of US adults with wireless internet access on laptops.
Importance of correct hypothesis statement formulation and decision-making based on test outcomes.
Transcripts
Browse More Related Video

Elementary Stats Lesson #18
One Tailed and Two Tailed Tests, Critical Values, & Significance Level - Inferential Statistics
Elementary Statistics Chapter 8 - Introduction Hypothesis Testing Part 1 Lesson 1
Math 119 Chap 8 part 1
8.3.1 Testing a Claim About a Mean - With Sigma Not Known, Three Equivalent Methods

t-Test - Full Course - Everything you need to know
5.0 / 5 (0 votes)
Thanks for rating: