How to find critical Z value (Z alpha)
TLDRIn this educational video, Marissa from Cal Poly Pomona explains the concept of Z of alpha in statistics. Z of alpha is the Z-score where the area under the standard normal distribution curve is equal to alpha. She illustrates this with examples, showing how to use the standard normal table to find Z values corresponding to areas of interest. Marissa emphasizes that the table provides the area before a Z value, so one must find 1 minus alpha to determine Z of alpha. She demonstrates this by finding Z scores for 0.25 and 0.05, and explains the importance of memorizing common Z values for statistical analysis. The lesson provides a clear understanding of how to interpret and use standard normal tables in statistical studies.
Takeaways
- 📚 Z of alpha is a statistical term representing the value on the Z-axis where the area under the standard normal distribution is equal to alpha.
- 📉 The standard normal table provides the area before a Z value, not after, so it is important to understand that Z of alpha is the value where the area after it is alpha.
- 🔢 If the area after Z of alpha is alpha, then the area before it is 1 - alpha, following the rule that the total area under the probability curve is 100%.
- 🔍 To find Z of alpha, one must look up 1 - alpha in the standard normal table to find the corresponding Z value.
- 📈 The script provides an example of finding Z for 0.25, which involves looking up 0.75 in the table and approximating the Z value by averaging between two given numbers.
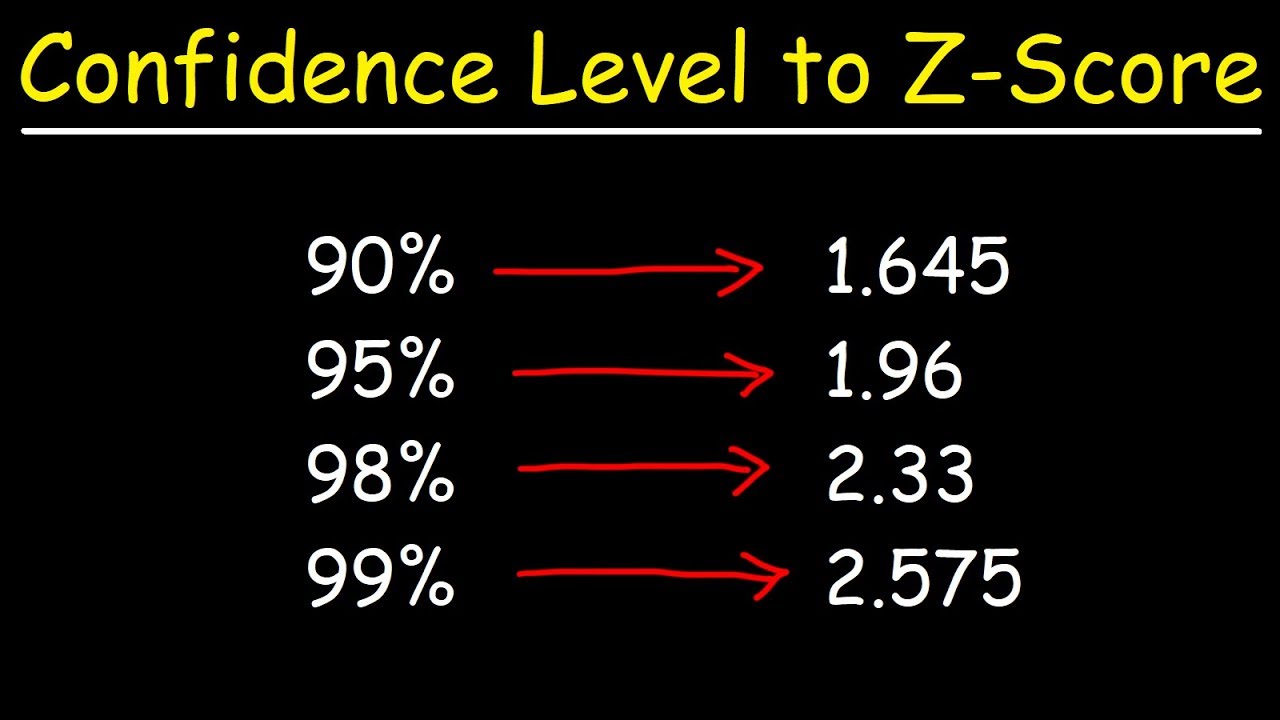
- 📊 Another example demonstrates finding Z for 0.05 by looking up 0.95 in the table, resulting in an approximate Z value of 1.645.
- 🧩 For Z of 0.025 and its complement 0.975, the table provides an exact Z value of 1.96 without the need for interpolation.
- 📝 A general rule for calculating Z of alpha is to find 1 - alpha in the table and report the associated Z value as Z of alpha.
- 📚 Memorizing commonly used values of Z of alpha is a good practice in statistics, as highlighted by the script.
- 👩🏫 The lesson is presented by Marissa from Cal Poly Pomona and aims to clarify the concept of Z of alpha in the context of statistics.
Q & A
What is the definition of Z of alpha in statistics?
-Z of alpha is the value of Z after which the area under the standard normal distribution is alpha.
How is the total area under the standard normal distribution represented in terms of probability?
-The total area under the standard normal distribution is represented as 100%, according to the rule of probability.
What is the relationship between Z of alpha and the area before Z?
-If the area after Z of alpha is alpha, then the area before Z of alpha is 1 minus alpha.
Why is it important to understand the area before Z of alpha?
-It's important because standard normal tables provide the area before a Z value, not after, so knowing the area before helps in finding the Z of alpha.
How does one find the Z value associated with a given probability using a standard normal table?
-One must find the area that corresponds to 1 minus the given probability in the table and then identify the associated Z value.
In the context of the script, what is the Z value for an area of 0.25 before Z?
-The Z value for an area of 0.25 before Z is approximately 0.675, found by averaging the Z values for 0.67 and 0.68 in the standard normal table.
What is the Z value for an area of 0.05 before Z according to the standard normal table?
-The Z value for an area of 0.05 before Z is 1.645, which is the average of the Z values for 1.64 and 1.65 in the standard normal table.
What is the relationship between Z of 0.025 and its complement in terms of the standard normal distribution?
-The complement of Z of 0.025 is Z of 0.975. This means that the area under the standard normal curve to the right of Z of 0.025 is 0.025, and before it is 0.975.
What is the Z value for Z of 0.025 and its complement?
-The Z value for Z of 0.025 is 1.96, which is the exact value found in the standard normal table for an area of 0.975 before Z.
What is the general rule for calculating Z of alpha using a standard normal table?
-The general rule is to find the value of 1 minus alpha in the table and report the associated Z value as Z of alpha.
Why is it suggested to memorize certain Z of alpha values in statistics?
-It is suggested to memorize certain Z of alpha values because they are commonly used in statistical analysis and can help in quickly making calculations without referring to a table.
Outlines
📚 Introduction to Z of Alpha in Statistics
In this educational video, Marissa from Cal Poly Pomona introduces the concept of Z of alpha in the context of statistics. Z of alpha is defined as the value on the Z-axis after which the area under the standard normal distribution is equal to alpha. The video uses an illustrative approach to explain the concept, emphasizing that standard normal tables provide the area before a Z value, not after. The importance of understanding this is highlighted, as it allows for the determination of Z of alpha using statistical tables. Marissa provides a step-by-step example to demonstrate how to find the Z value corresponding to a given area (alpha), by finding the complement (1 - alpha) in the table and then identifying the associated Z value. The process is explained with clarity, making it accessible for viewers to grasp the concept of Z of alpha and its application in statistical analysis.
Mindmap
Keywords
💡Z of alpha
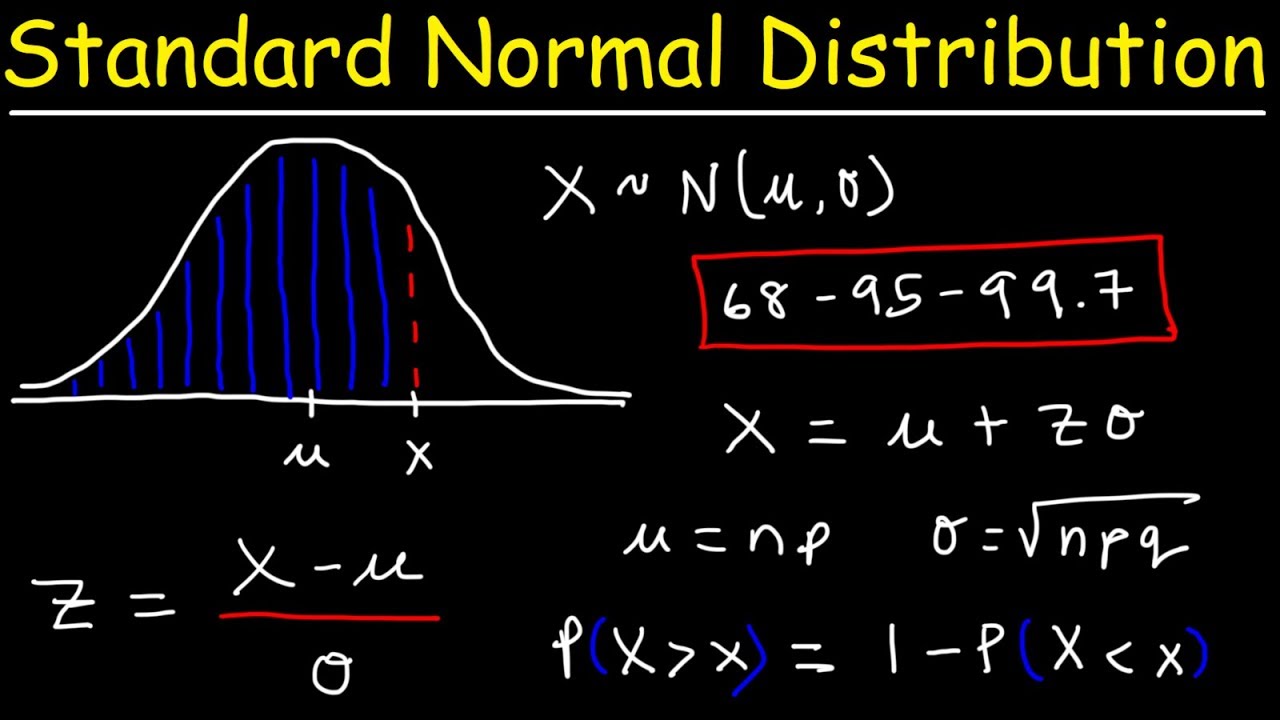
💡Standard normal distribution
💡Area under the curve
💡1 minus alpha
💡Standard normal table
💡Hypothesis testing
💡Confidence intervals
💡Interpolation
💡Probability
💡Complement
Highlights
Definition of Z of alpha in statistics is introduced.
Z of alpha is the value after which the area under the standard normal distribution is alpha.
Total area on the probability curve is always 100%.
Standard normal table gives the area before a Z value, not after.
To find Z of alpha, look for the area before it in the table.
Example: Finding Z for an area of 0.25, which corresponds to a probability of 0.75.
Interpolation is used to estimate Z values between table entries.
Average of two Z values can provide an approximation.
Example: Finding Z for an area of 0.05, which corresponds to a probability of 0.95.
Z value for 0.05 is approximately 1.645.
Z of 0.025 and its complement 0.975 are discussed with an example.
Z value for 0.025 is exactly 1.96, no interpolation needed.
General rule for calculating Z of alpha is to find 1 minus alpha in the table.
Memorizing commonly used Z of alpha values is recommended.
Practical application of finding Z values using standard normal table is demonstrated.
Importance of understanding the relationship between Z values and probabilities is emphasized.
The lesson concludes with a summary of the process for finding Z of alpha.
Transcripts
Browse More Related Video

Find the z-score given the confidence level

Z-Scores, Standardization, and the Standard Normal Distribution (5.3)
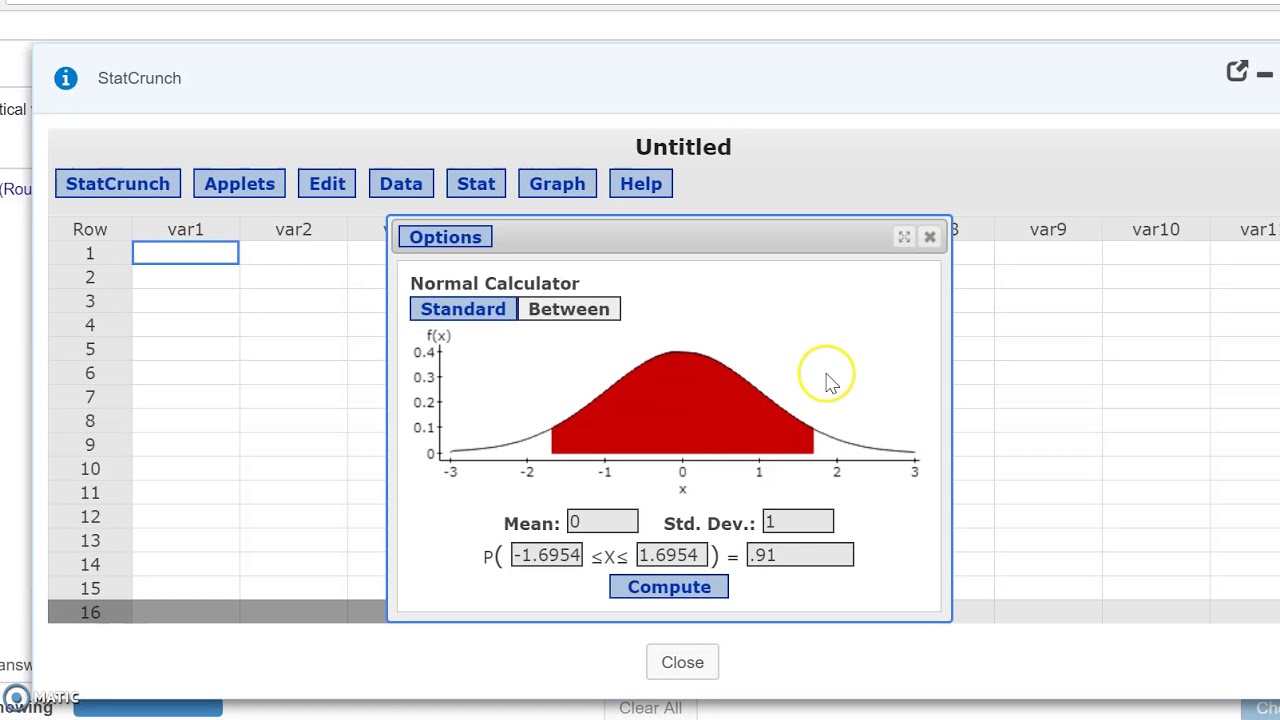
Find Critical Value Za/2 with Statcrunch
Standard Normal Distribution Tables, Z Scores, Probability & Empirical Rule - Stats
How To Find The Z Score Given The Confidence Level of a Normal Distribution 2

Elementary Stats Lesson #11
5.0 / 5 (0 votes)
Thanks for rating: