12.34 | Pure ozone decomposes slowly to oxygen, 2O3(g) → 3O2(g). Use the data provided in a
TLDRThis video script outlines the process of determining the order and rate constant of a chemical reaction involving the decomposition of ozone into oxygen. The presenter guides viewers through analyzing data tables, plotting graphs, and using a calculator to test for zero, first, and second order reactions. The method involves comparing the linearity of different graphs to identify the reaction order and calculating the rate constant using the slope of the linear graph for a second order reaction. The explanation is aimed at helping students understand the practical application of kinetics in chemistry.
Takeaways
- 📉 The decomposition of ozone (O3) into oxygen (O2) is studied using time and concentration data.
- 📈 The rate law for the reaction is expressed as rate = k [O3]^n, where k is the rate constant and n is the reaction order.
- ⏳ The data provided includes time intervals and corresponding concentrations of O3.
- 🔍 The goal is to determine the reaction order (n) and the rate constant (k) using the data.
- 📊 Three possible reaction orders are considered: zero order, first order, and second order.
- 📏 The reaction order is determined by finding which plot of the data yields a linear relationship.
- 🧮 For a zero-order reaction, the plot of concentration vs. time should be linear.
- 🔢 For a first-order reaction, the plot of the natural logarithm of concentration vs. time should be linear.
- ➗ For a second-order reaction, the plot of the inverse of concentration vs. time should be linear.
- ✅ After plotting, the data shows a linear relationship for the inverse of concentration vs. time, indicating a second-order reaction.
- 🔬 The rate constant (k) for the reaction is calculated from the slope of the linear plot for the second-order reaction.
- ⚙️ The units of the rate constant (k) for a second-order reaction are M^-1 hour^-1.
Q & A
What is the reaction involving ozone and oxygen mentioned in the script?
-The reaction discussed in the script is the decomposition of ozone (O3) into oxygen (O2). This is a chemical reaction where ozone slowly breaks down into oxygen.
What is the general form of the rate law for a reaction?
-The general form of the rate law for any reaction is rate = k[reactant]^n, where k is the rate constant, [reactant] is the concentration of the reactant, and n is the reaction order.
Why can't the coefficients of a reaction be directly used as the reaction order?
-The coefficients can only be used as the reaction order if the reaction is an elementary step. If it's not specified as an elementary step, the actual order must be determined experimentally, as done in the script.
How does the concentration of O3 change with time in the reaction?
-As time increases, the concentration of O3 decreases. This is expected as O3 is being converted into O2.
What method is used to determine the order of the reaction?
-The method used to determine the order of the reaction is by plotting the data and observing which plot (zeroth order, first order, or second order) results in a linear graph.
Why is a linear graph important in determining the reaction order?
-A linear graph indicates a direct proportionality between the variables, which in this case would mean a direct relationship between the concentration of O3 and time, indicating a specific reaction order.
What does a non-linear graph in the zeroth order plot indicate about the reaction?
-A non-linear graph in the zeroth order plot indicates that the reaction is not zeroth order, as a zeroth order reaction would result in a straight line when plotting concentration versus time.
How is the first order reaction plot different from the zeroth order plot?
-In the first order reaction plot, the natural log of the concentration of O3 is plotted against time. A linear graph in this plot would indicate a first order reaction.
What does the linear graph in the second order plot indicate?
-A linear graph in the second order plot, where 1/[O3] is plotted against time, indicates that the reaction is second order.
How is the rate constant (k) determined from the linear graph?
-The rate constant (k) is determined from the slope of the linear graph. The slope represents the rate constant for the reaction.
What are the units of the rate constant (k) for a second order reaction?
-For a second order reaction, the units of the rate constant (k) are typically in terms of the concentration units raised to the power of -1 and time raised to the power of -1 (e.g., M^-1s^-1 if concentration is in molarity and time is in seconds).
Outlines
🧪 Determining Reaction Order and Rate Constant
The script introduces a chemistry problem involving the decomposition of ozone into oxygen. It explains the generalized rate law and emphasizes the need to identify the reaction order by analyzing data provided in a table. The process involves using time and concentration values of ozone to determine if the reaction follows zero, first, or second order kinetics. The script guides through the use of a graphical method, suggesting that a linear graph will indicate the correct order.
📊 Data Input and Graphing for Zero Order Reaction
The speaker demonstrates how to input data into a calculator for analysis, focusing on setting up lists for time and ozone concentration. They attempt to graph the data to check for a zero order reaction by plotting time against concentration, expecting a straight line for confirmation. The process includes using the TI-84 calculator's stat and plot features, but the initial attempt does not yield a straight line, indicating the reaction is not zero order.
📈 Exploring First and Second Order Reactions
After the zero order attempt fails, the script moves on to test for first and second order reactions. For the first order, the natural logarithm of concentrations is taken, and for the second order, the reciprocal of concentrations is used. The process involves editing lists on the calculator and replotting the data. Eventually, a linear graph is achieved using the reciprocal of concentrations, confirming the reaction is second order.
📉 Calculating the Rate Constant for the Second Order Reaction
With the reaction order confirmed as second order, the script proceeds to calculate the rate constant (K). It explains the slope formula for a linear graph and demonstrates how to find the slope using two points on the graph. The units of K are discussed, highlighting that they depend on the order of the reaction and the units of time provided in the data. The final step is to perform the calculation to find the numerical value of K, ensuring to maintain significant figures.
Mindmap
Keywords
💡Ozone (O3)
💡Reaction Order
💡Rate Constant (k)
💡Graphical Method
💡Concentration
💡Time
💡Linear Line
💡Natural Logarithm (Ln)
💡TI-84 Calculator
💡Second-Order Reaction
💡Slope
Highlights
Introduction of the problem: determining the order and rate constant of the reaction where ozone decomposes to oxygen.
Explanation of the generalized rate law: rate equals the rate constant (K) times the concentration of the reactants raised to the order of the reaction.
Importance of identifying the reaction order to determine the exponent in the rate law.
Description of the data provided: time and concentration of ozone over seven different time intervals.
Explanation of how the concentration of ozone decreases as time increases, which is expected for a reactant.
Method for determining the reaction order by checking for a linear relationship in different plots (zero, first, and second order).
Instructions for inputting data into a TI-84 calculator to create lists of time and concentration values.
Procedure for testing zero-order reaction: plotting concentration vs. time and checking for a linear line.
Results of zero-order test: no linear line observed, indicating the reaction is not zero-order.
Procedure for testing first-order reaction: plotting natural log of concentration vs. time and checking for a linear line.
Results of first-order test: no linear line observed, indicating the reaction is not first-order.
Procedure for testing second-order reaction: plotting 1/concentration vs. time and checking for a linear line.
Results of second-order test: a linear line observed, indicating the reaction is second-order.
Explanation that the slope of the linear plot in the second-order test corresponds to the rate constant (K).
Calculation of the rate constant (K) using the slope formula and specific data points from the plot.
Determination of the units for the rate constant: molarity to the power of -1 and time to the power of -1, considering the time was in hours.
Final answer: the reaction is second-order with a rate constant of 50.1 M^-1 h^-1.
Transcripts
Browse More Related Video

12.32 | Describe how graphical methods can be used to determine the order of a reaction and its rate

12.33 | Use the data provided to graphically determine the order and rate constant of the following
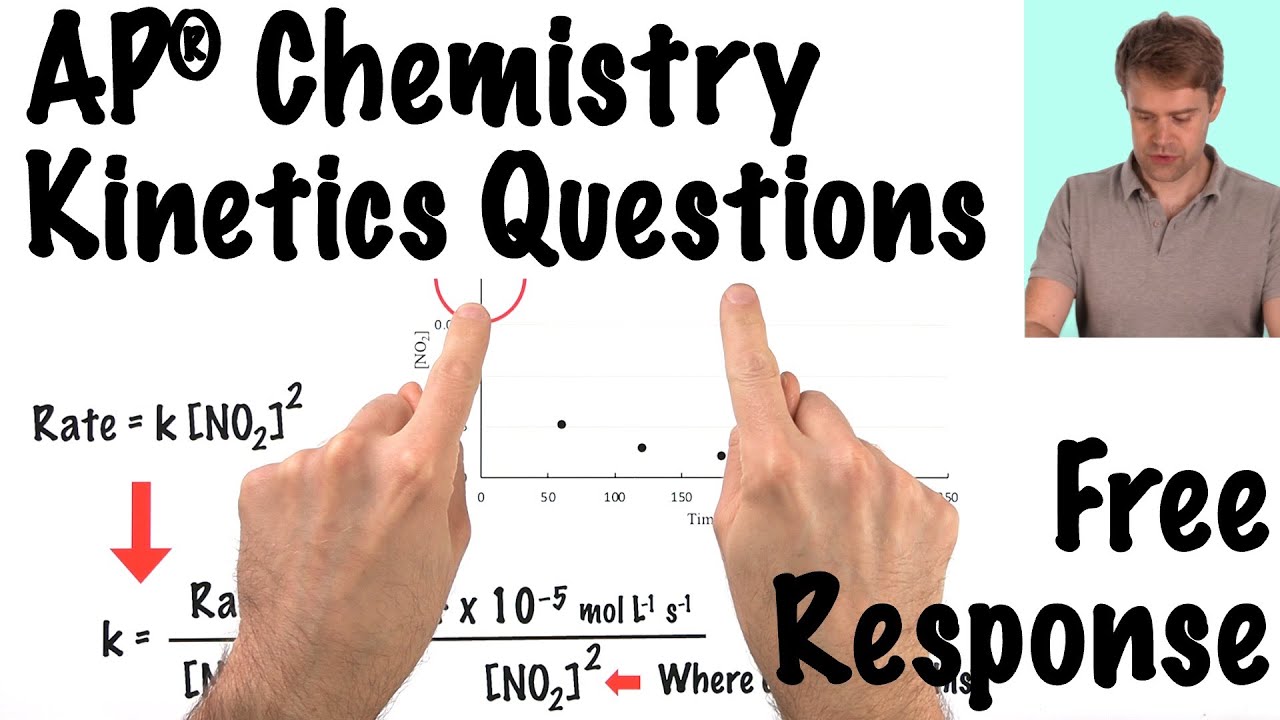
AP® Chemistry Kinetics Questions Free Response

Concentration Changes Over Time - AP Chem Unit 5, Topic 3
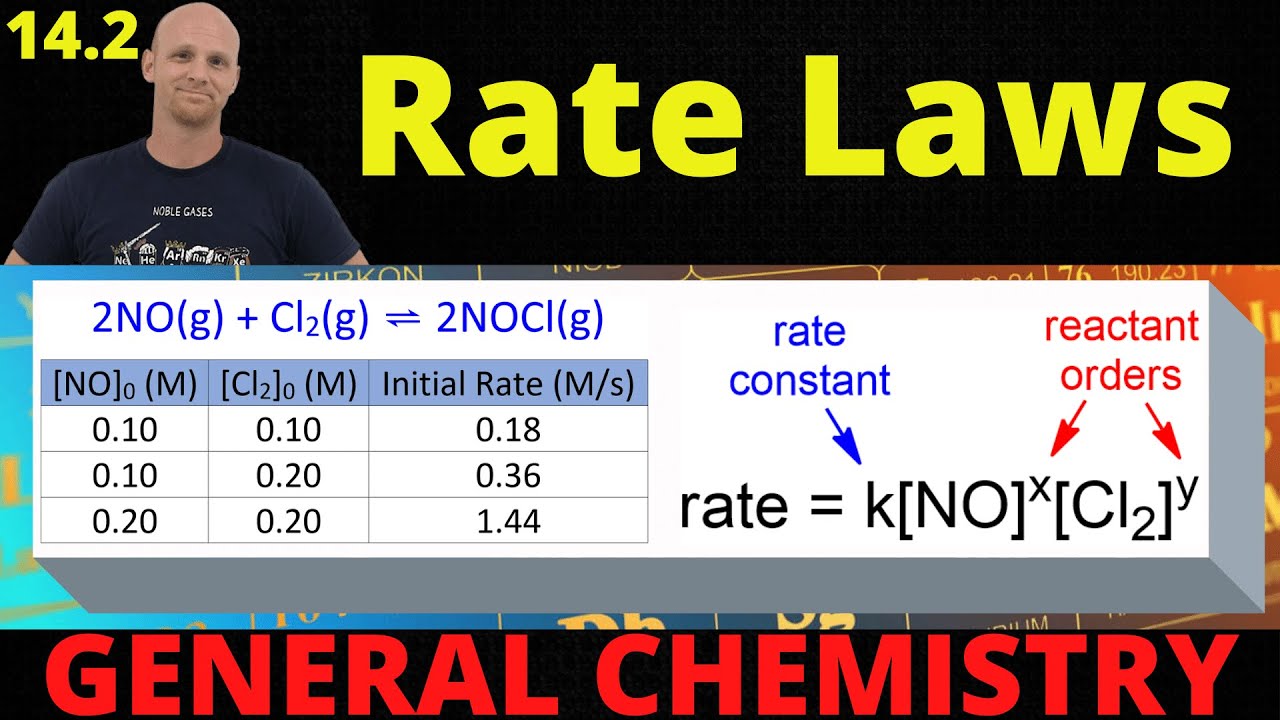
14.2 Rate Laws | General Chemistry
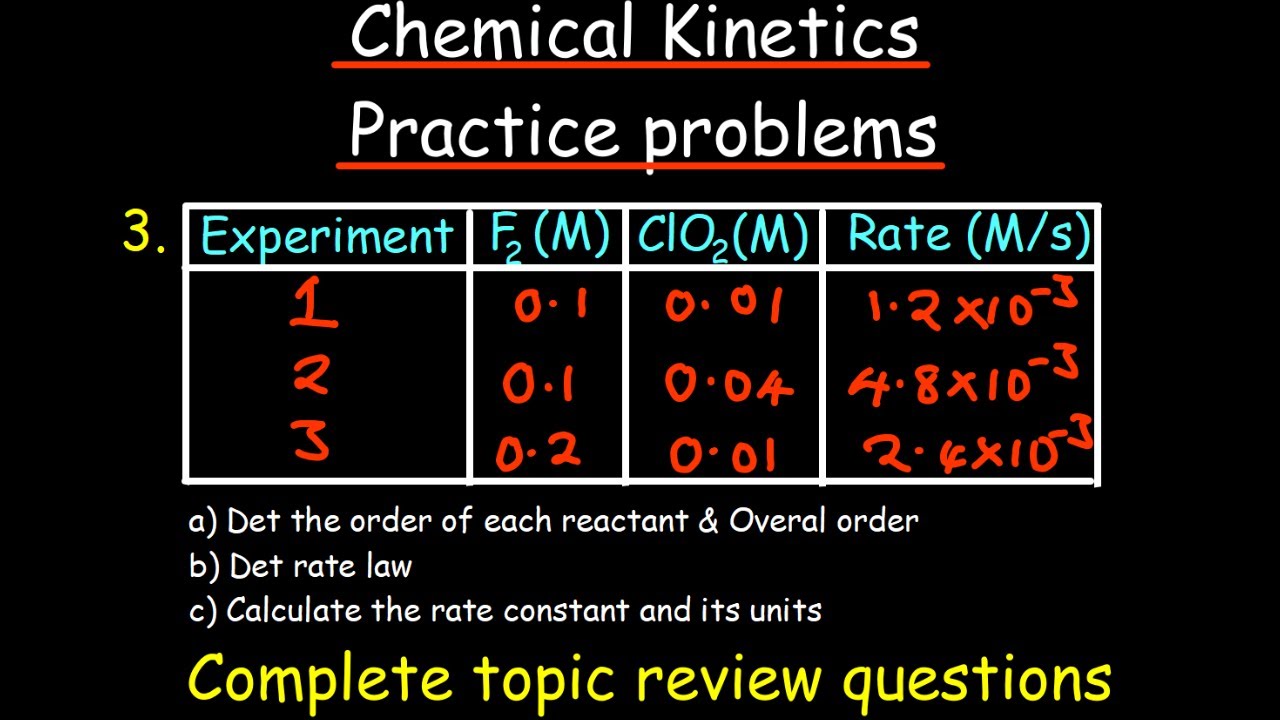
Chemical Kinetics practice problems - complete review
5.0 / 5 (0 votes)
Thanks for rating: