12.32 | Describe how graphical methods can be used to determine the order of a reaction and its rate
TLDRThis educational video script explains how to determine the order of a chemical reaction and its rate constant using graphical methods. It guides viewers through plotting concentration over time for zero, first, and second order reactions, highlighting the importance of recognizing linearity in graphs to identify the reaction order. The script emphasizes the inverse relationship between time and concentration, and how to calculate the rate constant from the slope of the lines, ensuring to convert negative slopes to positive rate constants.
Takeaways
- 📊 The script discusses using graphical methods to determine the order of a chemical reaction and its rate constant from concentration-time data.
- 🔍 It emphasizes starting with a zero-order reaction graph, plotting concentration over time, and looking for a straight line to confirm the reaction order.
- 📉 If the zero-order plot isn't linear, the script suggests moving on to a first-order reaction graph, which involves plotting the natural logarithm of concentration over time.
- 📈 For first-order reactions, a linear plot indicates the reaction is first-order, with the slope equal to -k (the negative rate constant, which is then taken as positive).
- 🔄 If neither zero nor first-order plots are linear, the script advises checking for a second-order reaction by plotting 1/concentration over time.
- 📐 The second-order reaction graph should show an increasing linear line, with the slope directly equal to k, the rate constant, which is inherently positive.
- 📝 The script provides hypothetical concentration values at different times to illustrate how to plot the data for each reaction order.
- 🤔 It suggests that if no linear relationship is found, there may be an issue with the data or the understanding of the reaction order.
- 🔢 The importance of understanding the inverse relationship between time and concentration for reactants is highlighted.
- 📚 The script is educational, aiming to help viewers understand how to analyze reaction orders through graphical methods.
- 👍 It ends with an encouragement for viewers to keep studying and learning, emphasizing continuous education in the field of chemistry.
Q & A
What is the purpose of using graphical methods in determining the order of a reaction and its rate constant?
-Graphical methods are used to visually analyze the relationship between the concentration of a reactant and time to determine the reaction's order and calculate its rate constant.
What is the general hypothesis when observing the concentration of a reactant over time?
-The general hypothesis is that as time increases, more of the reactant is converted into products, leading to a decrease in the concentration of the reactant.
How does the relationship between time and concentration change as the reaction progresses?
-There is an inverse relationship between time and concentration, meaning that as time increases, the concentration of the reactant decreases.
What type of graph is used to determine if a reaction is zero order?
-A zero order reaction is determined by plotting the concentration of the reactant over time. If the graph is a straight line, the reaction is zero order.
How is the rate constant for a zero order reaction calculated from the graph?
-The rate constant for a zero order reaction is calculated by finding the negative slope of the straight line graph. The slope value is then taken as positive because rate constants are always positive.
What transformation is applied to the concentration values when determining if a reaction is first order?
-When determining if a reaction is first order, the natural logarithm (Ln) of the concentration values is plotted against time.
How does the slope of a first order reaction graph relate to the rate constant?
-The slope of a first order reaction graph is equal to the negative of the rate constant (-k). The negative sign indicates the decreasing concentration over time, and the rate constant k is taken as a positive value.
What is the significance of plotting 1/[A] versus time for a second order reaction?
-Plotting 1/[A] versus time is significant for a second order reaction because if the graph is linear, it indicates that the reaction is second order. The slope of this graph directly equals the rate constant (k), which is always positive.
What should be done if the plotted graphs for zero and first order reactions do not yield a straight line?
-If the graphs for zero and first order reactions are not linear, one should proceed to plot the data for a second order reaction to see if it yields a straight line.
What is the expected outcome if the reaction is second order and the plotted graph is linear?
-If the reaction is second order and the plotted graph of 1/[A] versus time is linear, it confirms that the reaction is second order, and the slope of the line is equal to the rate constant k.
What should one consider if no linear graphs are obtained for any of the orders?
-If no linear graphs are obtained for zero, first, or second order reactions, it may indicate an error in data collection or analysis, and one should revisit the experimental setup or calculations.
Outlines
📈 Understanding Reaction Order and Rate Constants with Graphs
The first paragraph introduces the concept of using graphical methods to determine the order of a chemical reaction and its rate constant. It explains that by measuring the concentration of a reactant 'A' at different times, one can hypothesize an inverse relationship between time and concentration. The speaker illustrates this with an example of molarity values decreasing over time and suggests plotting these points to determine the reaction order. The paragraph emphasizes starting with a zero-order reaction graph, plotting concentration over time, and looking for a straight line to confirm the order. If the graph is not linear, other orders, such as first or second order, are considered.
📊 Finding the Rate Constant for Zero-Order Reactions
This paragraph delves into the specifics of determining the rate constant for zero-order reactions. It describes how to interpret the slope of a linear graph representing concentration over time, with the slope being the negative of the rate constant 'K'. Since 'K' must be positive, the negative slope is converted into a positive rate constant. The paragraph also addresses what to do if the initial graph is not linear, suggesting moving on to test for first-order reactions by plotting the natural logarithm of concentrations over time. The process of finding the slope and converting it to a positive 'K' value is reiterated for first-order reactions.
🔍 Exploring First and Second-Order Reactions with Graphs
The final paragraph continues the discussion on identifying reaction orders, focusing on first and second-order reactions. It explains that if the graph of the natural logarithm of concentrations versus time is not linear, one should consider a second-order reaction graph, where 1/concentration is plotted against time. A linear graph in this case indicates a second-order reaction, with the slope of the line being equal to the rate constant 'K', which is inherently positive. The paragraph concludes by emphasizing the importance of recognizing linear relationships in the graphs to determine the correct reaction order and by encouraging viewers to practice interpreting these graphical representations of chemical kinetics.
Mindmap
Keywords
💡Graphical Methods
💡Order of Reaction
💡Rate Constant
💡Concentration
💡Molarity
💡Zero Order Reaction
💡First Order Reaction
💡Second Order Reaction
💡Natural Logarithm (Ln)
💡Reciprocal
Highlights
Graphical methods can be used to determine the order of a reaction and its rate constant from a series of data.
Different types of graphs are used to find the reaction order and rate constant based on the concentration of a reactant at varying times.
A reactant's concentration typically decreases over time, establishing an inverse relationship with time.
Plotting concentration values over time can help identify the reaction order.
A straight line in a concentration vs. time graph indicates a zero-order reaction.
The rate constant for a zero-order reaction is found by taking the negative slope of the linear graph and converting it to a positive value.
If the concentration vs. time graph is not linear, it's not a zero-order reaction.
For first-order reactions, the natural logarithm of concentration values is plotted against time.
A linear graph of ln(concentration) vs. time confirms a first-order reaction.
The slope of the first-order graph, when negative, equals the rate constant k.
Second-order reactions are identified by plotting 1/concentration vs. time, which should result in an increasing linear line.
The slope of the second-order graph equals the rate constant k, and does not require conversion to a positive value.
The total order of a reaction in a second-order graph must equal two, indicating the reaction involves two units of the reactant.
If no linear lines are found in the graphs, it suggests an error in the data or the need to revisit the experimental setup.
The process involves starting with zero-order, then first-order, and finally second-order graphs to identify the correct reaction order.
The x-axis remains constant across all graphs, representing time, while the y-axis changes depending on the reaction order being tested.
The video aims to guide viewers through the process of identifying reaction orders and rate constants using graphical methods.
Transcripts
Browse More Related Video

12.33 | Use the data provided to graphically determine the order and rate constant of the following

12.34 | Pure ozone decomposes slowly to oxygen, 2O3(g) → 3O2(g). Use the data provided in a
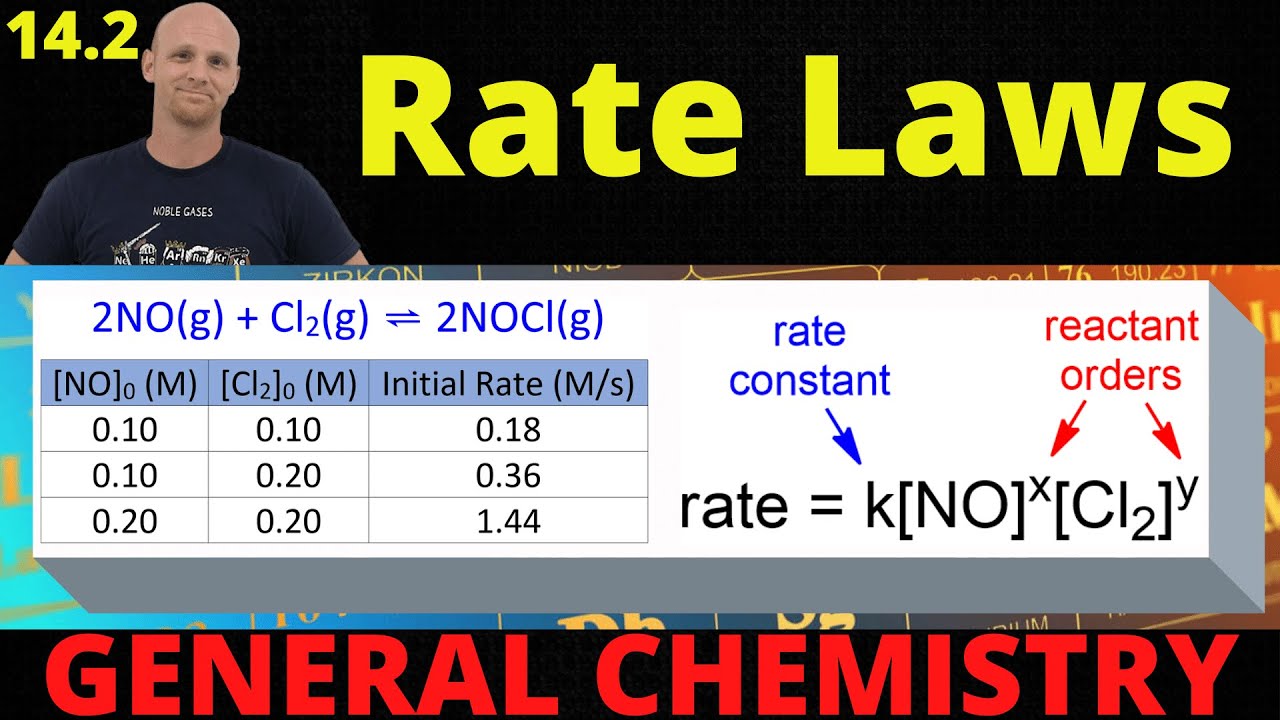
14.2 Rate Laws | General Chemistry
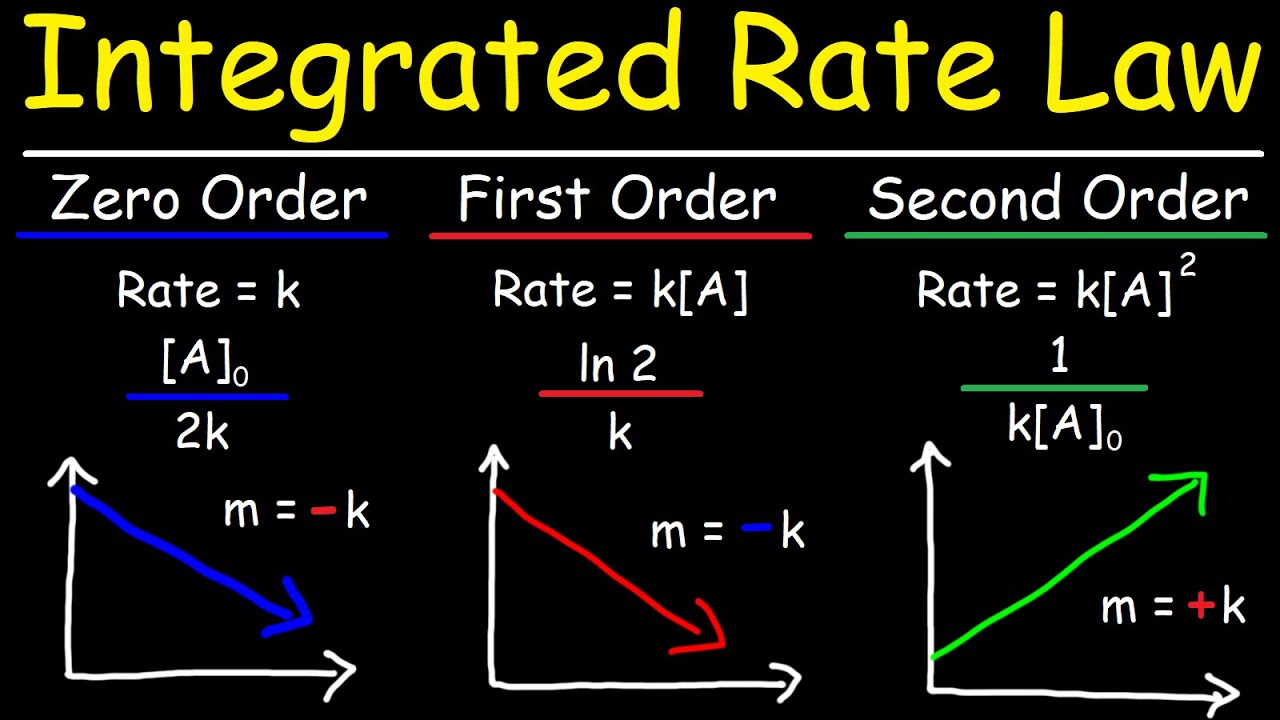
Integrated Rate Laws - Zero, First, & Second Order Reactions - Chemical Kinetics
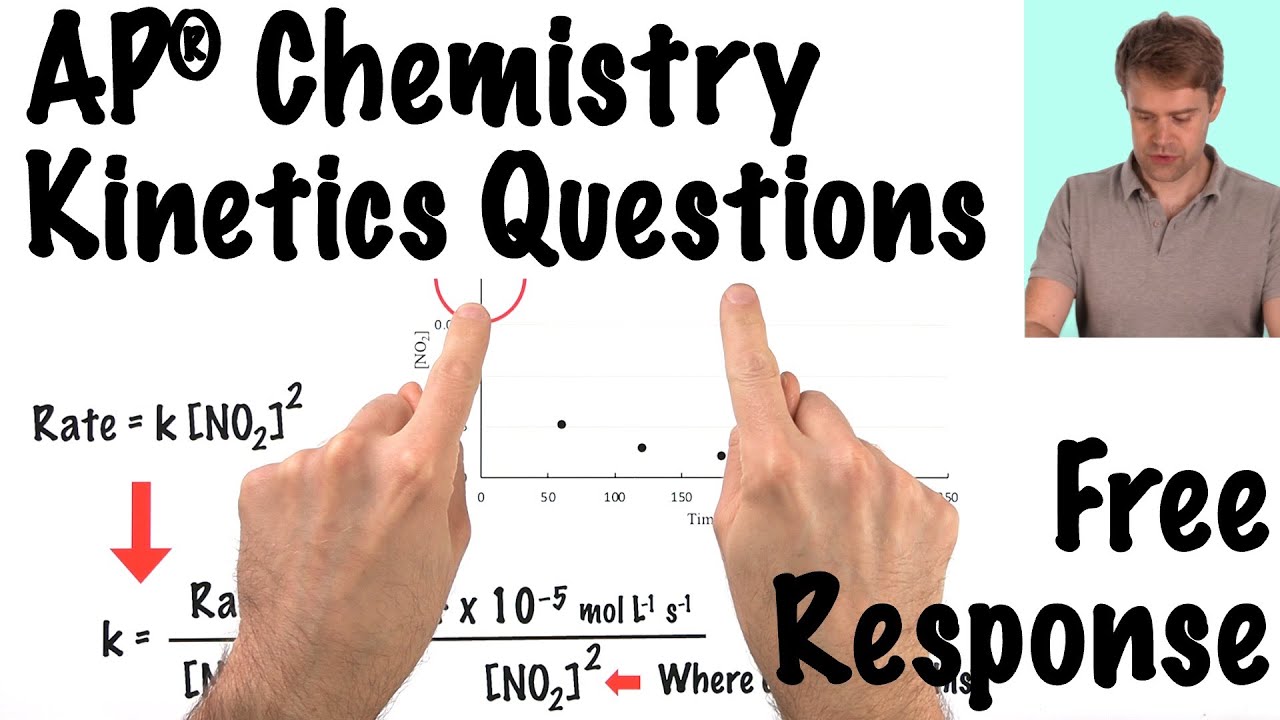
AP® Chemistry Kinetics Questions Free Response

Rate constant k from half-life example | Kinetics | Chemistry | Khan Academy
5.0 / 5 (0 votes)
Thanks for rating: