12.33 | Use the data provided to graphically determine the order and rate constant of the following
TLDRThis educational video script guides viewers through the process of determining the order and rate constant of a chemical reaction using graphical methods. The reaction in question involves SO2Cl2 yielding SO2 and Cl2. The script explains how to plot concentration versus time for zero-order reactions and how to use a calculator to graph the data. It demonstrates how to identify a first-order reaction by plotting the natural logarithm of concentration versus time and finding a linear relationship. The video concludes with calculating the rate constant from the slope of the line, emphasizing the importance of units and significant figures in scientific calculations.
Takeaways
- 📚 The video script is a tutorial on determining the order and rate constant of a chemical reaction graphically using provided data.
- 📈 The reaction in question is SO2Cl2 yielding SO2 plus Cl2, and the data is presented in a time versus concentration format.
- 🔍 The script emphasizes the importance of plotting the data to visually assess the reaction order through different types of graphs.
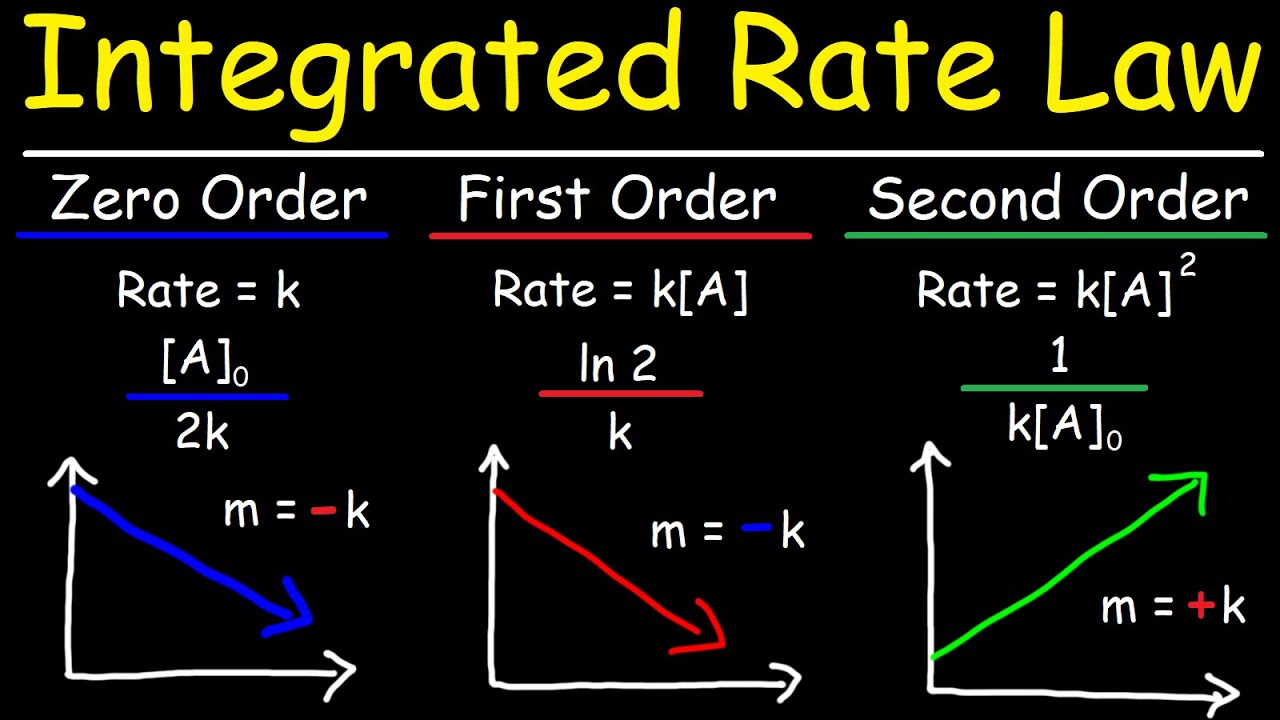
- 📊 It introduces three types of graphs to memorize for their units, which are crucial for identifying the reaction order when given a data chart.
- 📉 The script demonstrates how to use a calculator or graphing tool to plot concentration versus time for a potential zero-order reaction.
- ❌ The tutorial shows that if the plot is not a straight negative line, the reaction is not zero-order.
- 📝 The process then involves taking the natural logarithm of the concentration values to check for a first-order reaction, plotting these on a graph.
- 📐 It explains that a straight line on the ln-concentration versus time plot confirms a first-order reaction.
- 🔢 The rate law for a first-order reaction is introduced, highlighting that the rate constant (k) is positive, despite the negative slope of the line.
- 📝 The script provides a step-by-step guide on calculating the rate constant from the slope of the ln-concentration versus time graph.
- 🔑 The final takeaway is the formula for k, which is derived from the slope of the graph and has units dependent on the reaction order, in this case, seconds to the power of negative one.
Q & A
What is the reaction given in the script?
-The reaction given in the script is SO2Cl2 yielding SO2 plus Cl2.
What are the units for the concentration in the data chart mentioned in the script?
-The units for the concentration in the data chart are molarity.
What does the script suggest to do with the data sets provided?
-The script suggests to plot the data sets graphically to determine the order and rate constant of the reaction.
What are the three types of graphs that should be memorized according to the script?
-The three types of graphs to be memorized are for zero-order, first-order, and second-order reactions, as they help in determining the order of the reaction when given a data chart.
How does the script describe plotting a zero-order reaction?
-The script describes plotting a zero-order reaction by graphing concentration versus time and expecting a straight negative line if the reaction is zero-order.
What is the process of entering data into the calculator as described in the script?
-The process involves pressing the 'stat' button, editing, and entering the x-axis values into list L1 and the y-axis values into list L2.
What does the script say about the slope of a first-order reaction graph?
-The script states that the slope of a first-order reaction graph is the rate constant, and it should be a positive value even if the slope of the graph is negative.
How does the script suggest determining the rate constant for a first-order reaction?
-The script suggests determining the rate constant by finding the slope of the linear graph of the natural log of concentration versus time and taking the negative of that slope as the rate constant.
What is the significance of the units for the rate constant K in the context of the script?
-The significance of the units for the rate constant K is that they depend on the total order of the reaction. For a first-order reaction, the units for K are time to the power of -1, which in the script's case is seconds to the power of -1.
What is the final rate constant value found in the script for the reaction?
-The final rate constant value found in the script for the reaction is 2.20 times 10 to the negative fifth seconds to the power of -1.
Outlines
📈 Determining Reaction Order and Rate Constant
This paragraph explains how to use a data chart to determine the order and rate constant of a chemical reaction graphically. The reaction in question is the decomposition of SO2Cl2 into SO2 and Cl2. The data is presented in sets, with time on the x-axis and concentration (in molarity) on the y-axis. The speaker suggests plotting the data to identify the reaction order by comparing it with standard graphs for zero, first, and second order reactions. The process involves plotting concentration versus time for a zero order reaction and checking if the resulting line is straight and negative.
🔍 Analyzing Data to Confirm Reaction Order
The speaker proceeds to analyze the data using a calculator, specifically a TI-84, to plot the concentration versus time. They demonstrate how to enter data into lists L1 and L2, and then use the 'stat plot' feature to visualize the data. The goal is to determine if the reaction is zero order by checking for a linear relationship. The speaker uses the graph to conclude that the reaction is not zero order due to the non-linear nature of the plotted data. They then suggest taking the natural log of the concentration values to test for a first order reaction.
📚 Calculating the Rate Constant for a First Order Reaction
Having established that the reaction is first order through the linearity of the natural log plot, the speaker explains how to calculate the rate constant (k). They clarify that the slope of the line on the natural log plot is equal to -k, and since the slope is negative, k must be positive. The speaker demonstrates the process of finding two points on the graph, using the time values and their corresponding natural log concentrations, and applying the slope formula to calculate k. They correct a minor error regarding the exponent in the time values and provide the final calculation for the rate constant.
🏁 Concluding the Reaction Analysis with Rate Constant
The final paragraph wraps up the analysis by presenting the calculated rate constant, k, with its correct value and significant figures. The speaker emphasizes that the units of k are dependent on the overall reaction order, which in this case is first order, meaning the units are seconds to the power of negative one. The speaker concludes by summarizing the findings: the reaction is first order with a rate constant of 2.20 x 10^-5 seconds^-1. They encourage viewers to keep learning and studying, and sign off with a reminder to stay focused on education.
Mindmap
Keywords
💡Reaction Order
💡Rate Constant
💡Concentration
💡Graphical Determination
💡Zero Order Reaction
💡First Order Reaction
💡Second Order Reaction
💡Natural Logarithm
💡Slope
💡Significant Figures
Highlights
The process of graphically determining the order and rate constant of a chemical reaction using time versus concentration data.
Explanation of the confusion that can arise from the alternating presentation of time and concentration in the data sets.
Introduction to the three types of graphs that should be memorized for identifying the order of a reaction: zero, first, and second order.
Demonstration of plotting concentration versus time for a zero-order reaction and the expected straight negative line.
Use of a calculator's stat plot feature to graph data and analyze the linearity of the reaction.
The importance of plotting data correctly to determine if the reaction is zero-order by observing the linearity of the graph.
Transition to testing for a first-order reaction by taking the natural log of concentration values and plotting them against time.
Technique for editing data lists on a calculator to include logarithmic transformations for further analysis.
Observation that a linear graph with a negative slope indicates a first-order reaction.
Elimination of second-order as a possibility based on the linearity of the graph.
Writing the rate law for a first-order reaction with the identified reactant SO2Cl2.
Explanation of the relationship between the slope of the linear graph and the rate constant K for a first-order reaction.
Calculation of the rate constant K using the slope of the linear graph and ensuring the K value is positive.
Determination of the units for the rate constant K based on the overall order of the reaction.
Final calculation of the rate constant K with significant figures and its units in seconds to the negative first power.
Advice on maintaining focus on learning despite distractions, emphasizing the importance of education over immediate responses to messages.
Encouragement for viewers to continue studying hard and an invitation for feedback in the comments section.
Transcripts
Browse More Related Video

12.32 | Describe how graphical methods can be used to determine the order of a reaction and its rate

12.34 | Pure ozone decomposes slowly to oxygen, 2O3(g) → 3O2(g). Use the data provided in a

Concentration Changes Over Time - AP Chem Unit 5, Topic 3
Integrated Rate Laws - Zero, First, & Second Order Reactions - Chemical Kinetics

Rate constant k from half-life example | Kinetics | Chemistry | Khan Academy
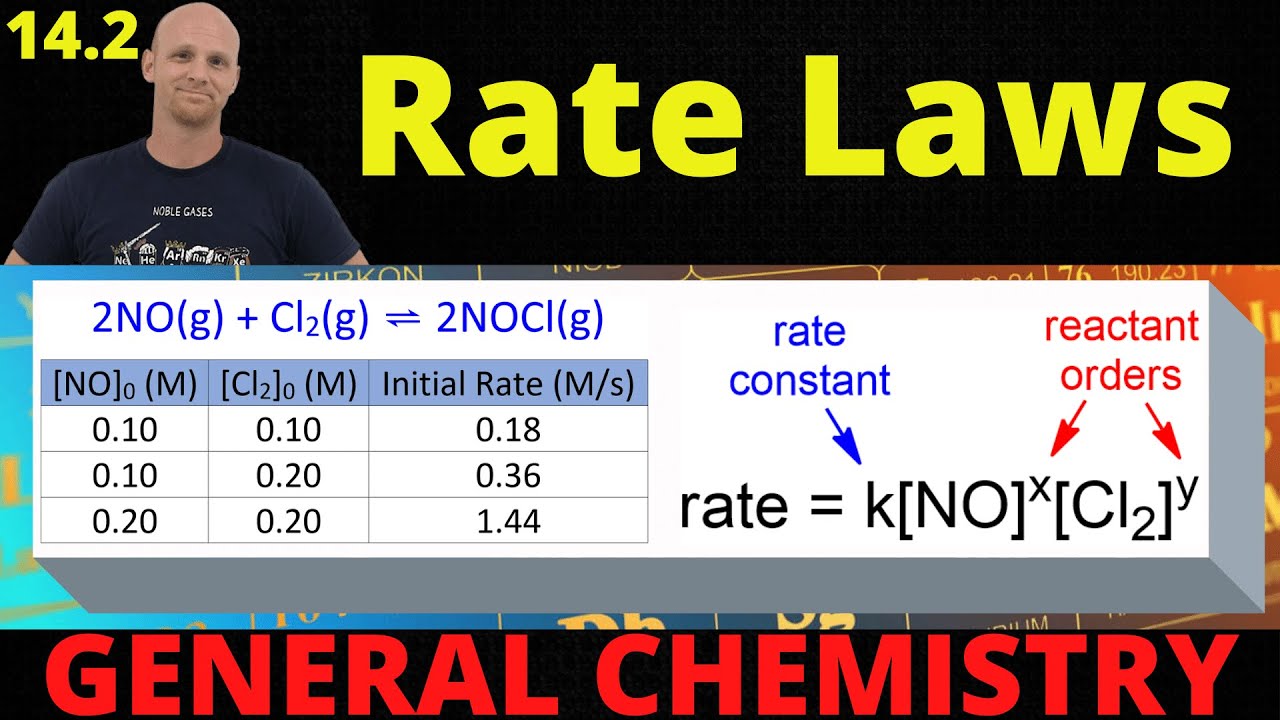
14.2 Rate Laws | General Chemistry
5.0 / 5 (0 votes)
Thanks for rating: