Completing an ANOVA table
TLDRIn this video, the presenter demonstrates how to complete an ANOVA table to determine if there is a difference in means among different treatment groups. Using a hypothetical example with Penn State football players and various dietary supplements, the video walks through calculating degrees of freedom, sum of squares, mean squares, and the F-statistic. The video explains the steps to find these values, interpret the results, and compare them against critical values from an F-distribution table to test the null hypothesis.
Takeaways
- 📊 The video provides a step-by-step guide on how to complete an ANOVA (Analysis of Variance) table using sample data.
- 🏈 The example scenario involves a study with a control group and three treatment groups (apples, kale, spinach) for improving speed in football players.
- 🔢 The total number of participants is 16, divided into four groups with four participants each.
- 📐 The degrees of freedom for the total group is calculated as the total number of participants minus one (16 - 1 = 15).
- 📉 The degrees of freedom for the treatment group is the number of treatments minus one (4 - 1 = 3), and for the error is the total degrees of freedom minus the treatment degrees of freedom (15 - 3 = 12).
- 🧮 The total sum of squares is calculated by summing the squared differences between each observed value and the grand mean, then summing these squared differences.
- 🍏 The treatment sum of squares is found by multiplying the mean of each group by the number of participants in that group, taking the difference from the grand mean, squaring it, and summing these values.
- 🚫 The error sum of squares is calculated by subtracting the treatment sum of squares from the total sum of squares.
- 📈 Mean squares are found by dividing the sum of squares by their respective degrees of freedom for both treatment and error.
- 📊 The F-statistic is calculated by dividing the mean squares of the treatment by the mean squares of the error.
- 📚 The video explains that if the calculated F-statistic is greater than the critical value found in an F-distribution table, the null hypothesis of no difference between group means is rejected.
Q & A
What is the main purpose of the video?
-The main purpose of the video is to demonstrate how to complete an ANOVA (Analysis of Variance) table using sample data.
What is the context of the sample data used in the video?
-The sample data is based on a hypothetical study where Penn State football players are given different supplements (apples, kale, spinach) to test if these affect their running speed over a two-hour period.
How many groups are included in the study presented in the video?
-There are four groups in the study: a control group and three treatment groups (apples, kale, and spinach).
What is the total number of participants in the study?
-There are 16 participants in total, with four participants in each of the four groups.
What is the formula for calculating the total degrees of freedom in an ANOVA table?
-The total degrees of freedom in an ANOVA table is calculated as the total number of participants (n) minus 1 (n - 1).
How are the degrees of freedom for the treatment calculated?
-The degrees of freedom for the treatment is calculated as the number of treatments (K) minus 1 (K - 1).
What is the formula for calculating the degrees of freedom for the error in an ANOVA table?
-The degrees of freedom for the error is calculated by subtracting the degrees of freedom for the treatment from the total degrees of freedom (total degrees of freedom - treatment degrees of freedom).
How is the sum of squares for the total group calculated in an ANOVA table?
-The sum of squares for the total group is calculated by summing the squared differences between each observed value (Y_ij) and the grand mean (Ŷ).
What is the formula for calculating the treatment sum of squares in an ANOVA table?
-The treatment sum of squares is calculated by summing the product of the number of participants in each group (n_i), the mean of each group (Ȳ_i) minus the grand mean (Ŷ), and the squared difference.
How is the error sum of squares found in an ANOVA table?
-The error sum of squares is found by subtracting the treatment sum of squares from the total sum of squares.
What is the purpose of calculating the mean squares in an ANOVA table?
-The mean squares are calculated to determine the average variance within the treatment groups and the error groups, which are used to calculate the F-statistic for testing the null hypothesis.
How is the F-statistic calculated in an ANOVA table?
-The F-statistic is calculated by dividing the mean squares of the treatment by the mean squares of the error.
What does the F-statistic help determine in an ANOVA analysis?
-The F-statistic helps determine whether there is a statistically significant difference between the means of the groups, which can be used to reject or fail to reject the null hypothesis.
What is the null hypothesis in the context of the video's ANOVA analysis?
-The null hypothesis in this context is that there is no difference between the control group and the treatment groups (apples, kale, and spinach) in terms of the mean running speed.
How does one determine if the null hypothesis should be rejected based on the F-statistic?
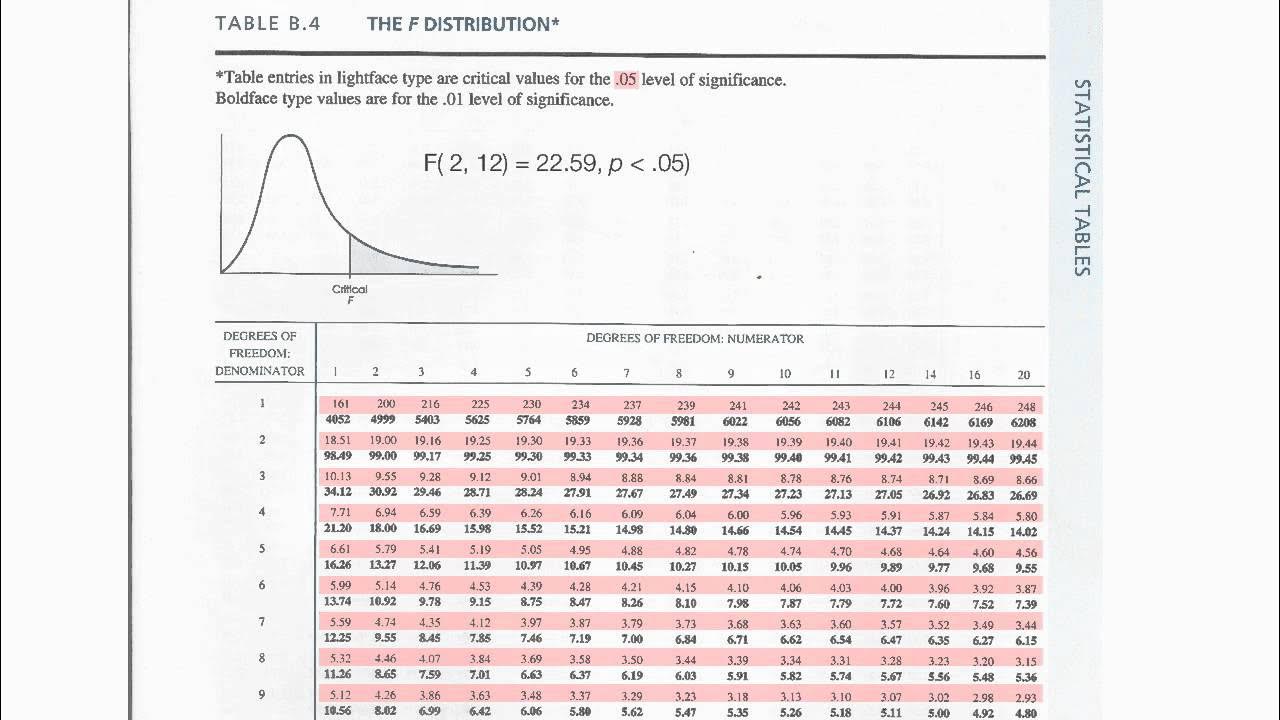
-The null hypothesis is rejected if the calculated F-statistic is greater than the critical F-value found in the F-distribution table corresponding to the desired confidence level and degrees of freedom.
Outlines
📊 Introduction to Completing an ANOVA Table
This paragraph introduces the video's purpose, which is to demonstrate how to complete an ANOVA (Analysis of Variance) table using sample data. The scenario involves a hypothetical study where Penn State football players are given a supplement of apples, kale, or spinach to improve their speed, measured by how many miles they can run in two hours. The control group receives no extra food items. The data includes four groups with four participants each, totaling 16 participants. The goal is to determine if there is a significant difference in means among these groups using an ANOVA table, and the video will guide through filling in the degrees of freedom and calculating the sum of squares, means of squares, and the F-statistic.
🔍 Calculating Degrees of Freedom for ANOVA
The speaker explains how to calculate the degrees of freedom for the total group, treatment group, and error group in an ANOVA table. The total degrees of freedom is found by subtracting one from the total number of participants (n-1), which in this case is 15. The treatment degrees of freedom is the number of treatments minus one (K-1), resulting in 3 for the four groups. The error degrees of freedom is the total degrees of freedom minus the treatment degrees of freedom, which equals 12. This step is crucial for setting up the ANOVA table correctly.
📘 Labeling and Sum of Squares Calculation
The paragraph details the process of labeling individual observations with subscripts to represent treatments (I) and participants within treatments (J). It then describes the calculation of the total sum of squares, which involves subtracting the grand mean from each observed value, squaring the result, and summing these values. The grand mean is calculated by summing all participant values and dividing by the total number of participants. The example given uses the control group's data to demonstrate this calculation, resulting in a total sum of squares of 104 for the entire dataset.
📐 Treatment and Error Sum of Squares
The video script continues with the calculation of the treatment sum of squares, which involves multiplying the mean of each treatment group by the number of participants in that group, subtracting the grand mean, squaring the result, and summing these values. The error sum of squares is then found by subtracting the treatment sum of squares from the total sum of squares. The example provided calculates these values, resulting in a treatment sum of squares of 83 and an error sum of squares of 21.
📉 Mean Squares and F-Statistic Calculation
This paragraph explains the calculation of mean squares for both the treatment and error groups by dividing the sum of squares by their respective degrees of freedom. The treatment mean square is calculated as 83 divided by 3, resulting in 27.67, while the error mean square is 21 divided by 12, equaling 1.75. The F-statistic is then determined by dividing the treatment mean square by the error mean square, yielding a value of 15.8114. This value is compared to a critical F-value from an F-distribution table to test the null hypothesis of no difference between group means.
🚫 Rejection of Null Hypothesis Based on F-Statistic
The final paragraph concludes the video script by comparing the calculated F-statistic to a critical F-value from an F-distribution table. With an F-statistic of 15.8114, which is greater than the critical value of 3.4903 for a 95% confidence interval and the given degrees of freedom, the null hypothesis is rejected. This indicates that there is a statistically significant difference between the means of the four groups, suggesting that the supplements (apples, kale, spinach) have an effect on the speed of the football players as measured by the distance they can run in two hours.
Mindmap
Keywords
💡ANOVA Table
💡Degrees of Freedom
💡Sum of Squares
💡Grand Mean
💡Treatment
💡Error
💡Mean Squares
💡F-Statistic
💡Null Hypothesis
💡Critical Value
Highlights
Introduction to completing an ANOVA table with necessary quantities.
Use of sample data involving a hypothetical study on the effect of dietary supplements on speed.
Explanation of the control group and the three treatment groups: apples, kale, and spinach.
Description of the experimental setup involving Penn State football players and their diet.
Total number of participants and the division into four groups.
The purpose of ANOVA to determine if there is a difference in means among groups.
Calculation of degrees of freedom for total, treatment, and error groups.
Method to calculate the sum of squares for the total group.
Explanation of labeling individual observations for clarity in calculations.
Process of finding the grand mean (Y-bar) for all participants.
Calculation of the treatment sum of squares using group means and participant counts.
Determination of the error sum of squares by subtracting treatment sum from total sum.
Explanation of calculating mean squares for treatment and error groups.
F-statistic calculation to compare mean squares of treatment and error.
Use of the F-table to determine the critical F value for statistical significance.
Comparison of the calculated F-statistic with the critical value to reject or accept the null hypothesis.
Interpretation of the F-statistic result indicating a difference between group means.
Conclusion summarizing the journey of research and the implications of the findings.
Transcripts
Browse More Related Video


5.0 / 5 (0 votes)
Thanks for rating: