Performing a One-way ANOVA in Excel with post-hoc t-tests
TLDRIn this tutorial, James Clark guides viewers through the process of analyzing three sets of data using ANOVA and post-hoc t-tests with Bonferroni correction in Excel. He explains the significance of standard error, demonstrates how to perform ANOVA to identify variance among groups, and shows how to conduct pairwise comparisons to pinpoint specific differences. The tutorial concludes with interpreting the results and adjusting significance levels to avoid errors in multiple comparisons.
Takeaways
- 📊 The video discusses the process of analyzing data from a t-test and introduces the concept of comparing three groups of data in a scientific experiment.
- 🔬 It emphasizes the importance of experimental design and running experiments under the same conditions to ensure validity.
- 📈 The script explains how to plot data with standard deviation bars and the limitations of visual analysis in determining significant differences.
- 🧐 The video provides a quick tutorial on calculating the standard error of the mean in Excel, which is crucial for error bars in data sets.
- 📝 It highlights the need for post-tests after an ANOVA to identify which specific groups are significantly different from each other.
- 🔢 The ANOVA process is demonstrated, including how to input data, interpret the results, and understand the significance of the p-value.
- ⚠️ The script warns about the necessity of adjusting significance levels when conducting multiple comparisons to avoid type I errors.
- 🤔 It introduces the Bonferroni correction as a method to adjust the significance threshold in the context of multiple hypothesis testing.
- 📋 The video shows how to perform post hoc t-tests between pairs of groups after an ANOVA to identify significant differences.
- 🌟 The importance of marking significant differences on graphs and reporting them in results sections is stressed, using stars or other symbols.
- 🔚 Finally, the script concludes with a summary of how to report the findings from an ANOVA and Bonferroni-corrected t-tests in a scientific context.
Q & A
What is the main focus of the tutorial presented by James Clark?
-The tutorial focuses on statistical analysis involving t-tests and ANOVA, specifically how to perform these tests on three sets of data using Excel, interpret the results, and apply post-test corrections like the Bonferroni correction.
What is the significance of having three groups in the data set, as opposed to two?
-Having three groups allows for more complex analyses, such as comparing the effects of a new variable or intervention (Group C) against the existing conditions (Groups A and B), and can provide insights into the impact of different experimental conditions.
Why is it important to run experiments with multiple groups under the same conditions and at the same time?
-Running experiments under the same conditions and simultaneously helps to control for external variables and ensures that any observed differences are due to the experimental manipulations rather than other factors.
What is the role of standard deviation and standard error in the context of this tutorial?
-Standard deviation provides a measure of the variability within each group, while standard error of the mean is used to calculate error bars in the data plot, indicating the precision of the mean estimates.
How does one calculate the standard error of the mean in Excel, as demonstrated in the tutorial?
-The standard error of the mean is calculated by dividing the standard deviation (small 's') by the square root of the sample size (N), which can be done using the STDEV and SQRT functions in Excel.
What is ANOVA and why is it used in this context?
-ANOVA, or Analysis of Variance, is a statistical method used to test for differences among three or more means. It is used here to determine if there are significant differences among the three groups (A, B, and C).
What is the purpose of a post-test in the context of ANOVA?
-A post-test is used after ANOVA to determine which specific groups are different from each other if the ANOVA result indicates significant differences among the groups.
What is the Bonferroni correction and why is it used in this tutorial?
-The Bonferroni correction is a statistical adjustment used to reduce the likelihood of Type I errors when making multiple comparisons. It is used here to adjust the significance threshold for the post-test t-tests after ANOVA.
How does the Bonferroni correction affect the significance threshold in this scenario?
-The Bonferroni correction divides the standard significance threshold (0.05) by the number of comparisons being made. In this case, with three comparisons, the threshold is adjusted to 0.05 / 3 = 0.0167.
What conclusions can be drawn from the ANOVA and post-test results presented in the tutorial?
-The conclusions drawn are that there is a significant variation among the three groups, and after applying the Bonferroni correction, Group B is found to be significantly higher than Group A, and Group C is significantly lower than Group B.
Outlines
📊 Analyzing Multiple Data Sets with T-test and ANOVA
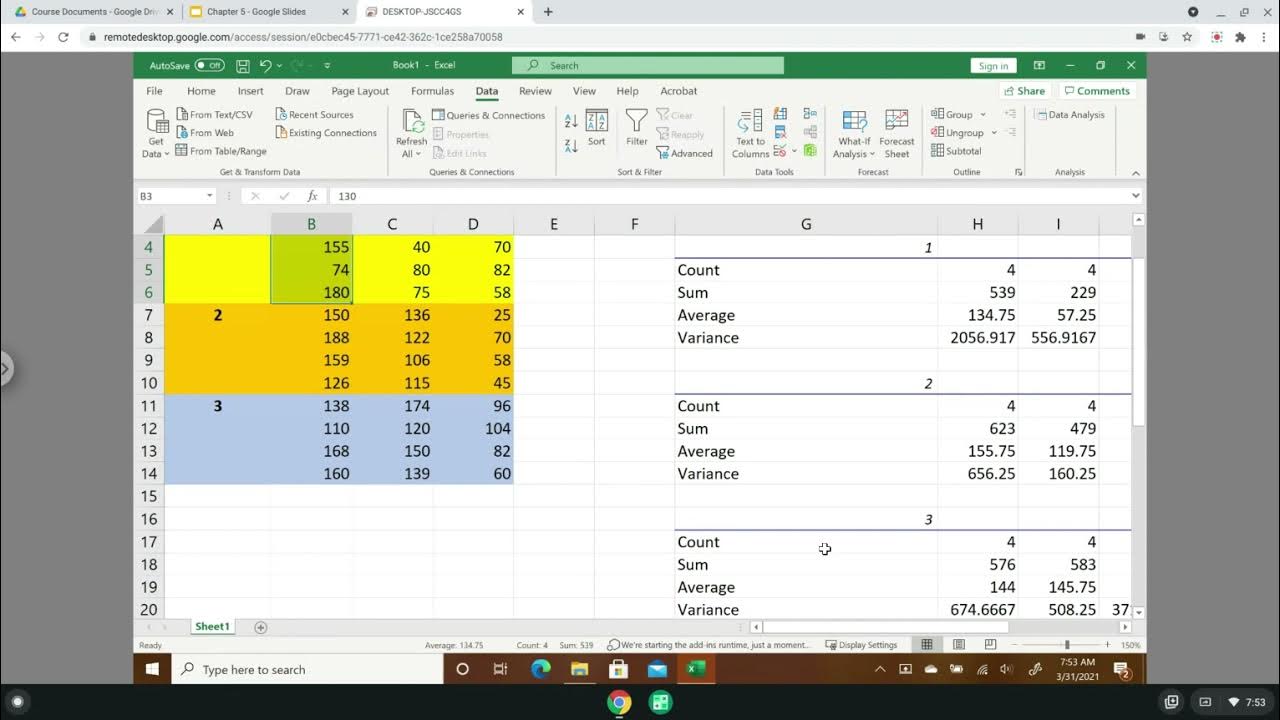
James Clark discusses the process of analyzing data from a t-test and introduces the concept of comparing three groups of data (Group A, B, and C) using ANOVA. He explains the importance of experimental design and the need to run experiments under the same conditions with proper replicates. The video demonstrates how to plot data with standard deviation bars and perform an ANOVA test in Excel. Additionally, Clark provides a quick tutorial on calculating standard error in Excel and emphasizes the limitations of Excel when it comes to performing post-tests after ANOVA to identify specific group differences.
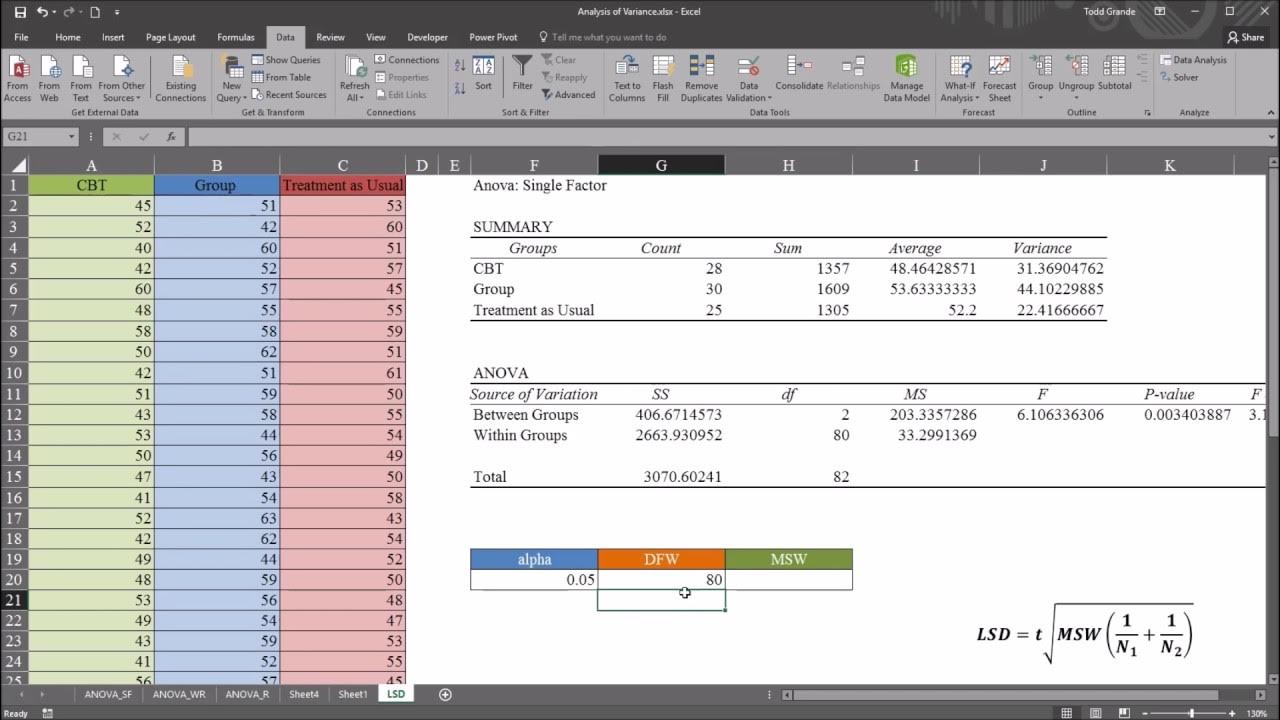
📈 Performing ANOVA and Post-hoc Tests in Excel
This paragraph delves into the specifics of conducting an ANOVA single-factor test in Excel with three groups of data. The process involves selecting the correct input range, choosing whether the data is grouped by columns or rows, and deciding on the output range for the results. The significance of the p-value in determining whether there are variations among the groups is highlighted. If the p-value indicates significance, post-hoc tests, specifically two-sample t-tests assuming equal variances, are performed to compare each pair of groups. The importance of a two-tailed t-test to determine if the means are different without specifying direction is also discussed.
🔍 Applying Bonferroni Correction for Multiple Comparisons
The final paragraph focuses on the statistical adjustments needed when making multiple comparisons to avoid type I errors. The Bonferroni correction is introduced as a method to adjust the significance level by dividing the standard alpha level (0.05) by the number of comparisons made. In this case, with three group comparisons, the new significance level is set at 0.0167. The video demonstrates how to apply this correction in Excel to determine if the differences between each pair of groups are statistically significant. The results are then used to annotate the ANOVA graph with stars indicating significant differences, concluding with a summary of the findings from the statistical analysis.
Mindmap
Keywords
💡t-test
💡ANOVA
💡post-test
💡standard deviation
💡standard error of the mean
💡Excel
💡Bonferroni correction
💡experimental design
💡replication
💡significant variation
💡data visualization
Highlights
Introduction to the completion of a t-test and presentation of results.
Explanation of significance in t-test results and the importance of proper experimental design.
Discussion on the necessity of running experiments under the same conditions and interleaved among each other.
Presentation of a new dataset with three groups and unequal sizes.
Visualization of data through a graph with standard deviation bars.
Brief tutorial on calculating standard error in Excel.
Demonstration of setting up standard deviation, standard error, and n-number in spreadsheets.
Introduction to the problem with Excel when performing ANOVA tests and the need for post-tests.
Guidance on using Excel's Data Analysis Toolpak for ANOVA Single Factor.
Explanation of the importance of p-values in ANOVA and the decision to proceed with post-tests.
Performance of post-test t-tests using a Bonferroni correction to adjust significance levels.
Detailed steps on conducting two-sample t-tests assuming equal variances in Excel.
Interpretation of t-test results and application of the Bonferroni correction to determine significance.
Final conclusion on the significant differences between groups based on ANOVA and t-test results.
Instructions on how to report findings in a results section with appropriate statistical evidence.
Emphasis on the importance of repeating T tests with corrections for multiple datasets.
Transcripts
Browse More Related Video

One-way ANOVA & Post-Hoc Analysis in Excel

Perform ANOVA Post-Hoc Tests (Bonferroni Correction) In Excel
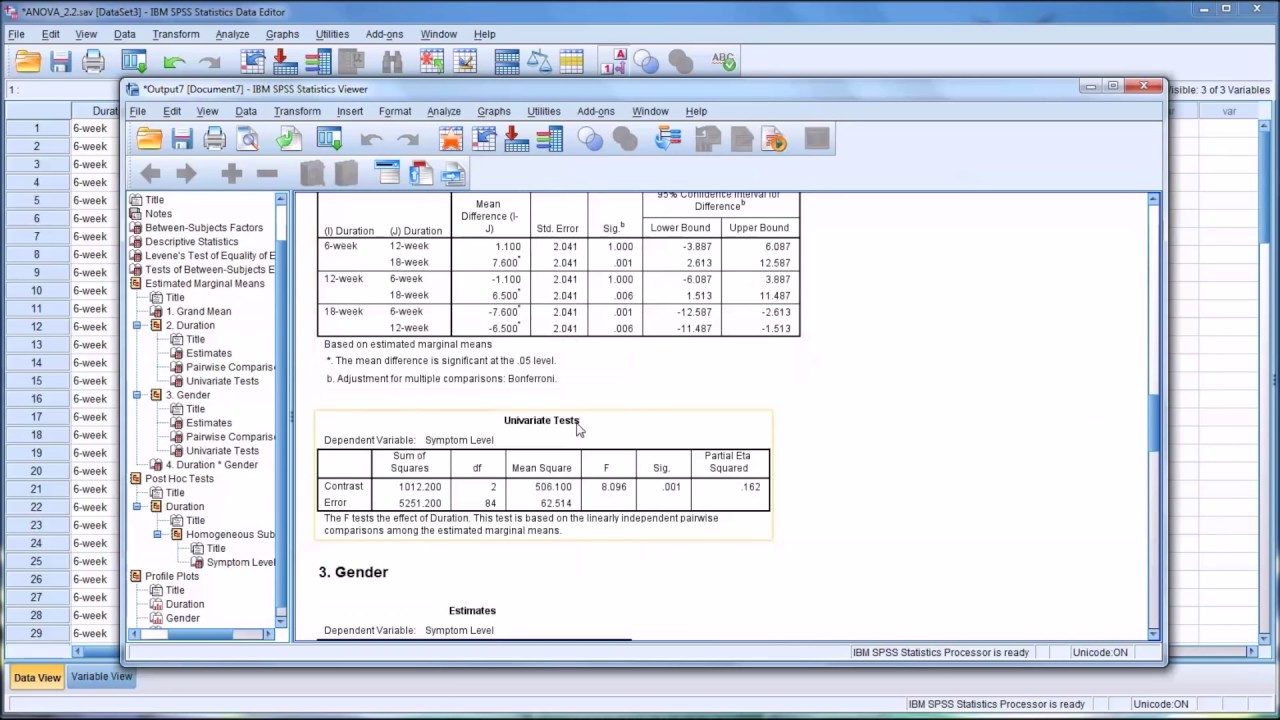
Conducting a Two-Way ANOVA in SPSS

How To Perform A One-Way ANOVA Test In Excel
One-Way ANOVA with LSD (Least Significant Difference) Post Hoc Test in Excel
ANOVA: Two Factor with replication, Residuals Analysis, and Tukey Test
5.0 / 5 (0 votes)
Thanks for rating: