Perform ANOVA Post-Hoc Tests (Bonferroni Correction) In Excel
TLDRThis tutorial demonstrates how to apply the Bonferroni correction in Excel following a significant one-way ANOVA test. The example uses rabbit body length data from three European regions to illustrate the process of identifying group differences with post-hoc tests. The video guides through performing individual t-tests and adjusting p-values with the Bonferroni method to control for type one errors due to multiple comparisons, concluding which regions' rabbits significantly differ in body length.
Takeaways
- 📚 The tutorial demonstrates how to perform the Bonferroni correction in Excel following a significant one-way ANOVA result.
- 🔍 The example involves comparing the body length of rabbits from three different European regions to determine if there are significant differences.
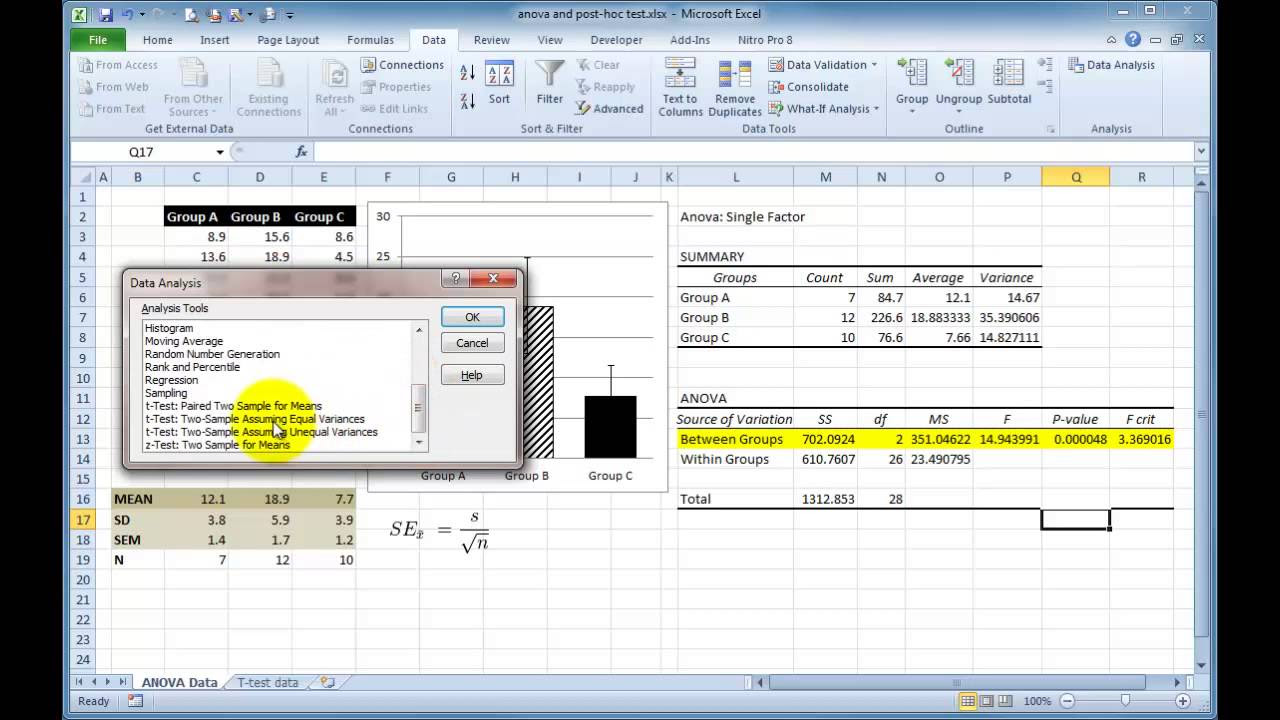
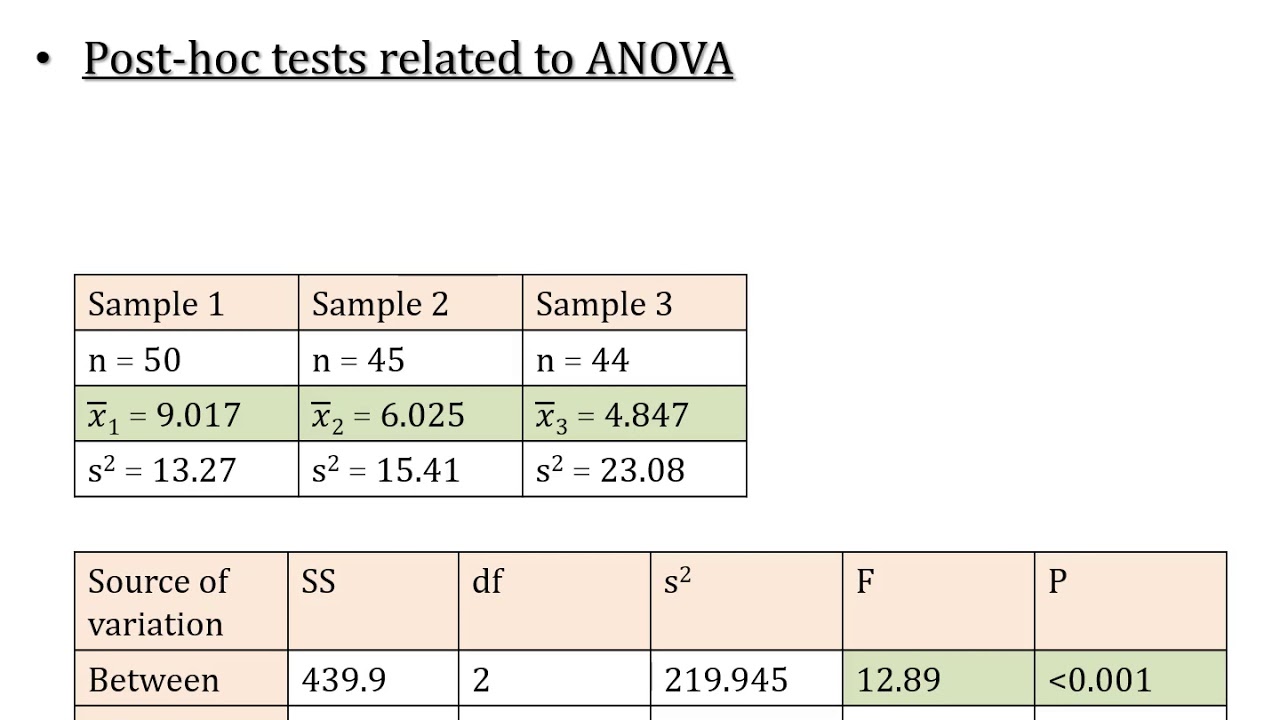
- 📊 A one-way ANOVA test was conducted, revealing a low p-value indicating significant differences between the average body lengths of the rabbit groups.
- 🧐 Post-hoc tests are necessary to pinpoint exactly which groups differ significantly from each other.
- 📝 The tutorial opts for individual Student's t-tests for post-hoc analysis and then corrects for multiple comparisons using the Bonferroni correction.
- 🔢 The Bonferroni correction is applied by dividing the original alpha level (0.05) by the number of post-hoc tests performed (3 in this case), resulting in a new alpha level of 0.0167.
- 📉 The p-values from the t-tests are compared against the Bonferroni-corrected alpha level to determine statistical significance.
- 📋 The IF function in Excel is used to automate the process of determining if a p-value is significant based on the Bonferroni correction.
- 📝 The final conclusion of the analysis is that rabbits from region 3 have a significantly longer body length compared to those from regions 1 and 2.
- 👍 The video encourages viewers to like, comment, and subscribe for more tutorials, emphasizing the importance of community engagement.
- 🔄 The process of replicating the Excel formula for multiple tests is explained, highlighting the use of dollar signs to maintain cell references.
Q & A
What is the purpose of the Bonferroni correction in statistical analysis?
-The Bonferroni correction is used to adjust the alpha level when performing multiple hypothesis tests to reduce the likelihood of Type I errors (false positives). It helps to control the family-wise error rate.
What statistical test does the tutorial cover for determining group differences after a significant one-way ANOVA result?
-The tutorial demonstrates how to perform post-hoc tests using individual Student's t-tests after a significant one-way ANOVA result to determine where the group differences lie.
What was the p-value obtained from the one-way ANOVA test in the tutorial example?
-The p-value from the one-way ANOVA test was very low and below the alpha level of 0.05, indicating a significant difference between the means of the groups.
How many rabbits were measured from each region in the example provided in the tutorial?
-In the example, 15 rabbits were measured from each of the three different regions in Europe.
What is the formula used in Excel to perform a two-sample t-test with equal variances and two tails?
-The formula used in Excel for a two-sample t-test with equal variances and two tails is: `=TTEST(range1, range2, 2, 2)`.
How many post-hoc tests are performed in the example provided in the script?
-Three post-hoc tests are performed in the example: comparing region 1 to region 2, region 2 to region 3, and region 3 to region 1.
What is the Bonferroni-corrected alpha level if the original alpha level is 0.05 and three post-hoc tests are performed?
-The Bonferroni-corrected alpha level is 0.05 divided by 3, which equals 0.0167.
How can you determine if a p-value is significant after applying the Bonferroni correction in Excel?
-You can use the IF function in Excel to compare the p-value with the Bonferroni-corrected alpha level and return 'Yes' if the p-value is less than or equal to the corrected alpha level, and 'No' otherwise.
What does the '$' symbol do when used in the IF function formula in Excel?
-The '$' symbol is used to create an absolute reference to the cell containing the Bonferroni-corrected alpha level, ensuring that the cell reference does not change when the formula is copied down.
What conclusion can be drawn from the post-hoc analyses with the Bonferroni correction in the tutorial example?
-The conclusion is that the rabbits in region 3 were significantly longer in body length compared with the rabbits from regions 2 and 1, after performing the one-way ANOVA test and post-hoc analyses with the Bonferroni correction.
Outlines
📊 Performing Bonferroni Correction Post One-Way ANOVA
This paragraph introduces a tutorial on applying the Bonferroni correction in Excel after a significant one-way ANOVA result. The speaker explains the context of the tutorial, which involves comparing the body lengths of rabbits from three European regions. The initial ANOVA test revealed significant differences between the groups, prompting the need for post-hoc tests to pinpoint where these differences lie. The tutorial suggests using individual Student's t-tests for each possible group comparison and then correcting for multiple comparisons using the Bonferroni method. The speaker also mentions a previous tutorial for those unfamiliar with the ANOVA test and its interpretation in Excel.
📘 Conducting Post-Hoc Tests and Applying Bonferroni Correction
The second paragraph delves into the specifics of conducting post-hoc tests using Student's t-tests for each group comparison and then applying the Bonferroni correction to adjust the alpha level for multiple hypotheses testing. The speaker demonstrates how to perform a two-sample t-test in Excel and emphasizes the importance of the Bonferroni correction to reduce the risk of type I errors due to multiple testing. The tutorial provides a step-by-step guide on calculating the Bonferroni-corrected alpha level and using Excel's IF function to automatically determine the significance of each post-hoc test result. The speaker concludes by summarizing the findings from the rabbit body length study, indicating that region 3's rabbits were significantly longer than those from regions 1 and 2 after the Bonferroni correction.
Mindmap
Keywords
💡Bonferroni Correction
💡One-Way ANOVA
💡Post-Hoc Tests
💡Student's t-test
💡P-Value
💡Alpha Level
💡Type I Error
💡Excel
💡Multiple Comparisons
💡Significance
💡IF Function
Highlights
Tutorial demonstrates the Bonferroni correction in Excel following a significant one-way ANOVA.
The example uses rabbit body length measurements from three different European regions.
A one-way ANOVA test reveals significant differences between the average rabbit body lengths of the regions.
Post-hoc tests are necessary to determine which specific groups are significantly different.
The tutorial recommends performing individual Student t-tests for each group comparison.
The Bonferroni correction is introduced to adjust for multiple comparisons.
The original alpha level of 0.05 is divided by the number of post-hoc tests to apply the Bonferroni correction.
Excel formulas are used to calculate the Bonferroni-corrected alpha level.
The p-values from the t-tests are compared against the Bonferroni-corrected alpha level to determine significance.
Excel's IF function is used to automatically determine the significance of post-hoc tests.
The use of dollar signs in Excel formulas ensures the Bonferroni-corrected alpha level remains constant when formulas are copied.
The final analysis concludes that rabbits in region 3 have a significantly longer body length compared to regions 1 and 2.
The tutorial emphasizes the importance of the Bonferroni correction to avoid false positives in multiple hypothesis testing.
The video provides a step-by-step guide on performing Student t-tests in Excel.
The tutorial offers a brief overview of the one-way ANOVA test for context.
The video is part of a series on statistical tests in Excel, with a previous tutorial on one-way ANOVA.
The tutorial encourages viewers to subscribe for more weekly statistical tutorials.
Transcripts
Browse More Related Video
Performing a One-way ANOVA in Excel with post-hoc t-tests

One-way ANOVA & Post-Hoc Analysis in Excel

How To... Perform a One-Way ANOVA Test in SPSS
LSD; Least Significant Difference; Post Hoc Test of ANOVA; Comparison of Means (Part A)

How to do a One-Way ANOVA in SPSS (12-6)

Duncan Multiple Range Test (DMRT) with Compact Letter Display
5.0 / 5 (0 votes)
Thanks for rating: