LSD; Least Significant Difference; Post Hoc Test of ANOVA; Comparison of Means (Part B)
TLDRThis lecture delves into the concept and application of post-hoc tests, specifically Fisher's Least Significant Difference (LSD) test, developed in 1935. The LSD test is a multi-step pairwise comparison used after ANOVA to determine which sample means are significantly different. The formula for LSD calculation is explained, involving t-values and variance within from the ANOVA table. The lecture includes step-by-step exercises on analyzing starling mass data and fish autolet diameter at various temperatures, demonstrating how to calculate LSD at different significance levels and interpret the results, identifying specific significant mean differences.
Takeaways
- 🔍 The script discusses the concept of post-hoc tests, specifically focusing on Fisher's Least Significant Difference (LSD) test, which is used for pairwise comparisons after ANOVA to determine which group means are significantly different.
- 📚 Fisher's LSD test was developed by Ronald Fisher in 1935 and is a standard method for multiple comparison after ANOVA when the number of groups is small to moderate.
- 📉 The LSD test involves calculating the least significant difference between two means using a formula that incorporates the t-value from the t-distribution table, the variance within groups from the ANOVA table, and the number of observations.
- 📝 The script provides a step-by-step guide on how to perform LSD calculations at different levels of significance (0.05, 0.01, and 0.001) and interpret the results to identify significant differences between group means.
- 🔢 The process includes calculating the LSD for each pair of means separately, especially when sample sizes are unequal, which requires different LSD values for different pairs.
- ⚖️ The significance of the difference between group means is determined by comparing the calculated LSD with the actual mean difference; if the mean difference exceeds the LSD, the difference is considered significant.
- 📉 The script uses two examples to illustrate the application of LSD: one with starlings sampled from different roosting places and another with fish exposed to different temperatures.
- 📋 The results of the LSD test provide a detailed analysis that goes beyond the overall significance indicated by ANOVA, pinpointing exactly which group means differ significantly from each other.
- 📊 The script emphasizes the importance of conducting LSD tests at progressively lower levels of significance (0.05 to 0.01 to 0.001) for pairs that remain significant at higher levels to confirm the robustness of the findings.
- 📈 The final results are presented in a tabular format, showing which mean pairs are significantly different and at what level of significance, offering a clear summary of the pairwise comparisons.
- 📝 The script concludes by highlighting the utility of post-hoc tests like LSD in providing a more nuanced understanding of group differences after an initial ANOVA analysis has indicated overall significance.
Q & A
What is a post-hoc test and why is it needed after ANOVA?
-A post-hoc test is used after ANOVA to determine which specific group means are significantly different from each other when the overall ANOVA indicates a significant difference. It is needed because ANOVA only tells us that at least one group mean is different, but not which ones.
Who developed the Least Significant Difference (LSD) test and when?
-The Least Significant Difference (LSD) test was developed by Fisher in 1935, which is why it is also known as Fisher's LSD test.
What is the main formula used for calculating the Least Significant Difference (LSD)?
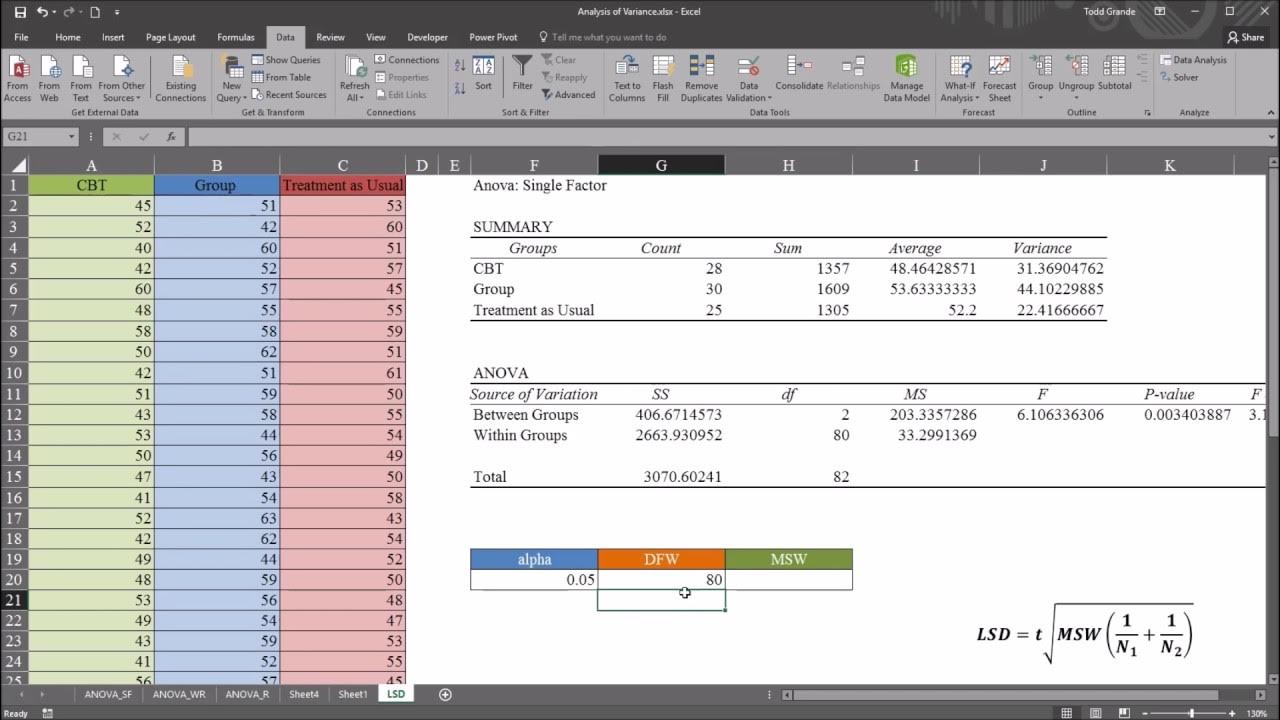
-The main formula for calculating LSD involves using the t-value from the t-distribution table at a specific degree of freedom and significance level, multiplying it by the square root of the within-group variance multiplied by the appropriate factor based on the number of observations.
How does the LSD test determine significance between mean pairs?
-The LSD test determines significance by comparing the difference between each pair of means to the calculated LSD value. If the mean difference is greater than the LSD, the difference is considered significant.
What does the significance level of 0.05 mean in the context of LSD testing?
-A significance level of 0.05 means that there is a 5% chance that the observed difference between means is due to random variation rather than a true difference. It is the threshold for determining statistical significance in the LSD test.
Why are multiple levels of significance used in LSD testing?
-Multiple levels of significance are used to perform more stringent tests on the mean pairs that were found significant at a higher level (e.g., 0.05), to confirm the robustness of the findings and to reduce the likelihood of Type I errors.
What does 'ns' signify in the context of the LSD test results?
-'ns' stands for 'non-significant' and is used to denote that the difference between a pair of means is not statistically significant at the given level of significance.
What is the purpose of repeating the LSD calculation at different significance levels?
-Repeating the LSD calculation at different significance levels allows for a more nuanced understanding of the data, identifying which mean differences remain significant under more stringent conditions.
How does the number of observations affect the LSD calculation?
-The number of observations affects the LSD calculation because it influences the within-group variance and the degrees of freedom used in the t-value lookup from the t-distribution table.
Can you provide an example of how to interpret the results of an LSD test from the transcript?
-An example from the transcript is the comparison of the mean mass of starlings from different roosting places. The LSD test revealed that the mean mass difference between reed bed and cliff, and tree and cliff were highly significant (p < 0.01), while differences between other pairs were non-significant.
What is the practical implication of finding significant differences between certain pairs of means but not others in LSD testing?
-The practical implication is that it allows researchers to identify specific groups that differ from each other, which can inform further investigation, decision-making, or policy changes based on the significant findings.
Outlines
🔍 Introduction to Post-Hoc Tests and LSD
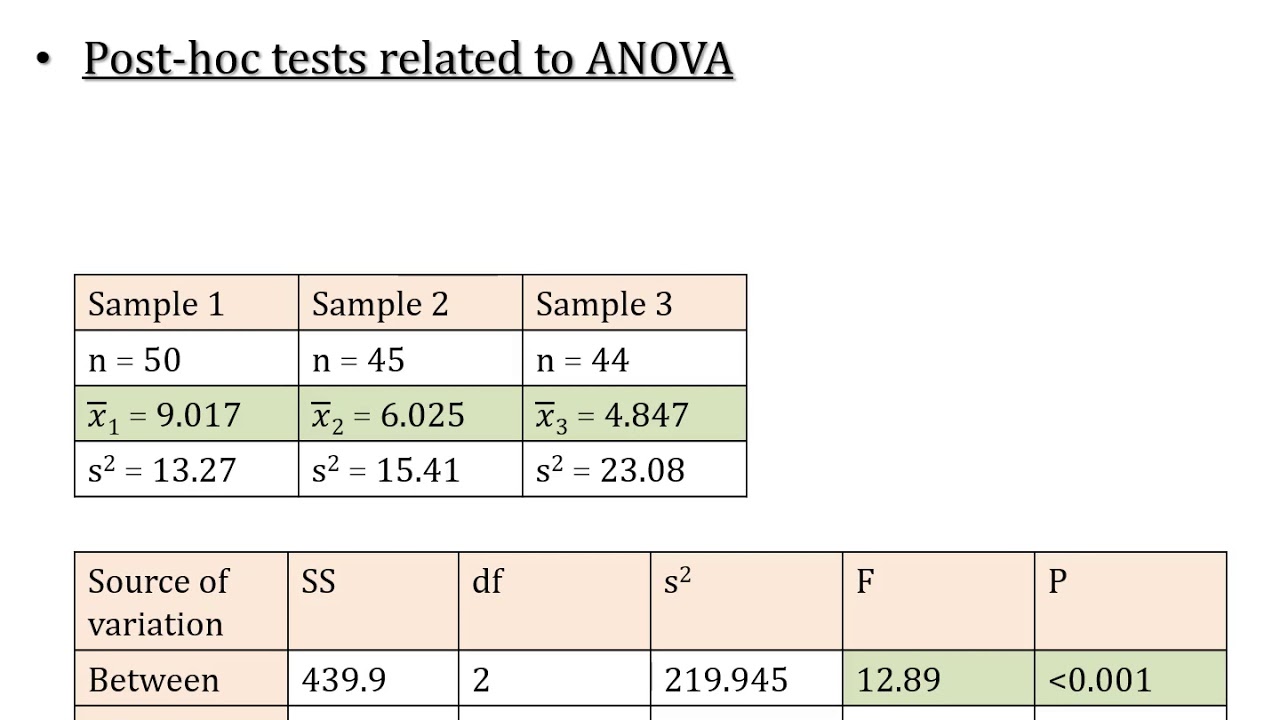
This paragraph introduces the concept of post-hoc tests, specifically focusing on Fisher's Least Significant Difference (LSD) test, developed in 1935. The LSD is a method used to determine which means are significantly different from each other after a significant F-test in ANOVA. The formula for LSD is explained, involving the t-value from the t-distribution table, degrees of freedom (v), and the desired level of significance (alpha). The process of conducting pairwise comparisons and the conditions under which the test is applied are discussed, including the use of variance within from the ANOVA table and the number of observations (n). The paragraph also outlines the stepwise approach to conducting LSD tests at different significance levels, starting with 0.05, followed by 0.01 and 0.001, with each step only testing pairs that were significant in the previous step.
📊 Calculation and Application of LSD Test
The paragraph details the process of calculating the Least Significant Difference (LSD) at a 0.05 significance level using a given formula and dataset. It explains how to use the t-value, variance within from the ANOVA table, and the number of observations to compute the LSD value for pairwise comparisons of sample means. The calculated LSD value is then used to compare mean differences to determine if they are significant or non-significant. The paragraph also discusses the next steps of conducting the LSD test at 0.01 and 0.001 significance levels, emphasizing that these tests are only performed on pairs that were found significant at the previous level.
📉 Further Analysis at 0.01 Significance Level
This section describes the continuation of the LSD test at the 0.01 significance level for the pairs that were found significant at the 0.05 level. It explains the re-calculation of the LSD using a different t-value for the 0.01 significance level and the same variance within from the ANOVA table. The comparison of mean differences with the newly calculated LSD value is discussed, with the result indicating which pairs remain significant at the 0.01 level. The paragraph also sets the stage for further analysis at the 0.001 significance level for the pairs that are significant at 0.01.
🔬 Detailed LSD Analysis and Results Interpretation
The paragraph presents the final stage of the LSD analysis at the 0.001 significance level, focusing only on the pairs that were significant at the 0.01 level. It explains the calculation of the LSD using a t-value for the 0.001 significance level and the variance within from the ANOVA table. The comparison of mean differences with the LSD value at this level is discussed, and the results show which pairs are very highly significant. The paragraph concludes with the presentation of the results in a table format, indicating the significance levels of the differences between sample means.
🐟 LSD Application in Fish Autolet Diameter Study
This paragraph discusses the application of the LSD test to determine significant differences in the mean autolet diameter of fish exposed to different temperatures. It outlines the process of creating a table for pairwise differences in means and calculating the LSD for each pair at the 0.05 significance level, taking into account the different number of observations in each sample. The results of the pairwise comparisons are summarized, highlighting which pairs are significant and which are not.
📝 Conducting LSD Test for Different Sample Observations
The paragraph describes the process of conducting the LSD test when the number of observations in each sample is different. It explains how to calculate the LSD for each pair of samples at the 0.05 significance level, using the appropriate t-value, variance within, and number of observations for each specific pair. The calculated LSD values are then used to compare the mean differences and determine their significance. The paragraph also discusses the continuation of the test at the 0.01 significance level for the pairs that were found significant at the 0.05 level.
📉 Significance Testing at 0.01 and 0.001 Levels
This paragraph details the continuation of the LSD test at the 0.01 and 0.001 significance levels for the pairs that were found significant at the 0.05 level. It explains the re-calculation of the LSD using the appropriate t-values for both significance levels and the comparison of mean differences with these new LSD values. The results indicate which pairs are highly significant at the 0.01 level and very highly significant at the 0.001 level. The paragraph concludes with the presentation of the final LSD table, summarizing the significance of the differences between sample means.
📚 Summary of LSD Exercises and Methodology
The final paragraph provides a summary of the LSD exercises conducted for the day, highlighting the methodology used for both exercises involving different numbers of samples and observations. It emphasizes the importance of the LSD test as a post-hoc analysis tool following ANOVA to identify which specific mean pairs are significantly different. The paragraph concludes by reiterating the results of the exercises and the general approach to performing and interpreting the LSD test.
Mindmap
Keywords
💡Post hoc tests
💡Least Significant Difference (LSD)
💡ANOVA
💡Significance Level
💡Pairwise Comparisons
💡Degrees of Freedom
💡Descriptive Statistics
💡T-Distribution
💡Variance
💡Non-significant
Highlights
Post hoc tests are necessary after ANOVA to determine which specific means are significantly different from each other.
Least Significant Difference (LSD) is a post hoc test developed by Fisher in 1935 to compare pairs of means after a significant ANOVA result.
LSD is calculated using a formula involving the t value from the t-distribution table, degrees of freedom, and the desired level of significance.
The t value and variance within are taken from the ANOVA table, and the number of observations is considered for the LSD calculation.
If the difference between a mean pair is greater than the LSD, the difference is considered significant.
LSD is calculated at different significance levels (0.05, 0.01, 0.001) to determine the robustness of the significant differences.
The exercise involves analyzing the mean mass of starlings from different roosting places using ANOVA and LSD.
Descriptive statistics and ANOVA summary tables are used for calculating ANOVA and LSD.
Pairwise differences in means are calculated to identify specific differences between sample means.
LSD is used to determine if the differences between specific pairs of means are significant at various significance levels.
The significance of differences is marked with asterisks, with more asterisks indicating higher significance levels.
The results of LSD analysis provide detailed insights into which specific mean pairs are significantly different, beyond the overall ANOVA result.
In the first exercise, two pairs of means were found to be significantly different at the 0.05 significance level.
Further analysis at the 0.01 significance level confirmed the significance of the same pairs and introduced a higher level of confidence in the results.
The exercise demonstrates the step-by-step process of conducting LSD analysis following an ANOVA test.
The second exercise involves analyzing the mean autolet diameter of fish at different temperatures using LSD.
In the second exercise, different numbers of observations in samples required separate LSD calculations for each pair.
The results of the second exercise showed very highly significant differences between certain samples, while others were non-significant.
Transcripts
Browse More Related Video
LSD; Least Significant Difference; Post Hoc Test of ANOVA; Comparison of Means (Part A)

Fisher's LSD Explained

Statistics 101: ANOVA Post Hoc Test (Fisher's LSD)
One-Way ANOVA with LSD (Least Significant Difference) Post Hoc Test in Excel

Statistics 101: ANOVA Post Hoc in Excel (Fisher's LSD)
Tukey Kramer Multiple Comparison Procedure and ANOVA with Excel
5.0 / 5 (0 votes)
Thanks for rating: