Statistics 101: ANOVA Post Hoc in Excel (Fisher's LSD)
TLDRThis tutorial video guides viewers through calculating Fisher's Least Significant Difference (LSD) test statistic and threshold in Excel. It builds on a previous video discussing ANOVA post hoc analysis, focusing on visualizing data with box plots and conducting a one-way ANOVA. The presenter demonstrates how to manually calculate the LSD test statistic and threshold using Excel's data analysis tool, comparing mean wait times of three roller coasters to determine statistically significant differences. The video concludes with a visual confirmation of these differences, providing a practical application of statistical analysis.
Takeaways
- 📈 The video tutorial focuses on performing Fisher's LSD test statistic and threshold calculation in Excel, following a previous video on ANOVA post hoc analysis.
- 🔗 A companion spreadsheet is available for download from the video description to follow along with the tutorial.
- 🎢 The data used in the example are wait times for roller coasters at Kings Island amusement park, with 25 observations for each of the three roller coasters.
- 📊 A box plot is recommended for visualizing the data for ANOVA, which helps in identifying potential significant differences between the groups.
- 📋 Fisher's LSD test is chosen for demonstration due to its ease of understanding and calculation, among other post hoc tests like Tukey, Bonferroni, and Scheffé's.
- ⚙️ Excel's built-in Data Analysis Toolpak is utilized to perform a one-way ANOVA, which requires selecting 'Labels in first row' and setting the alpha level to .05.
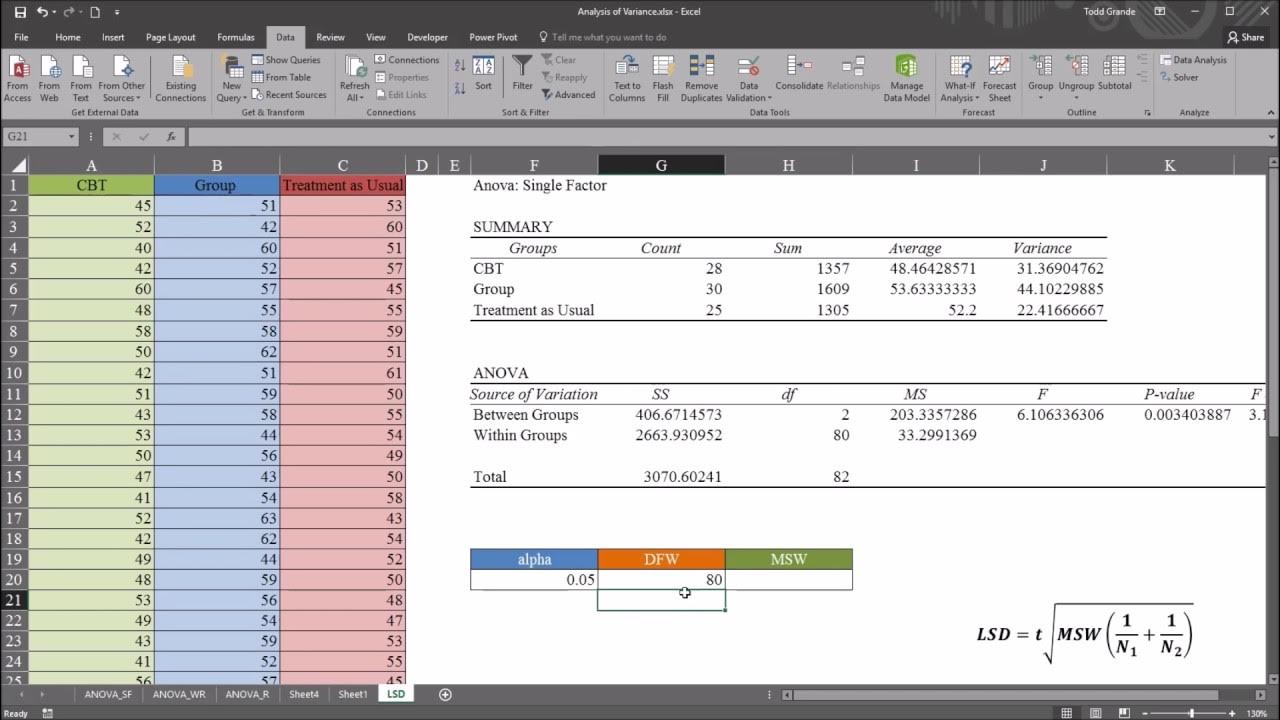
- 📝 The ANOVA table generated by Excel provides the necessary statistics, including the mean square error (MSE) and degrees of freedom, for further calculations.
- 📉 Differences in mean wait times between each pair of roller coasters are calculated using simple subtraction.
- 📊 The standard error of the difference is computed using the MSE and the number of observations for each group.
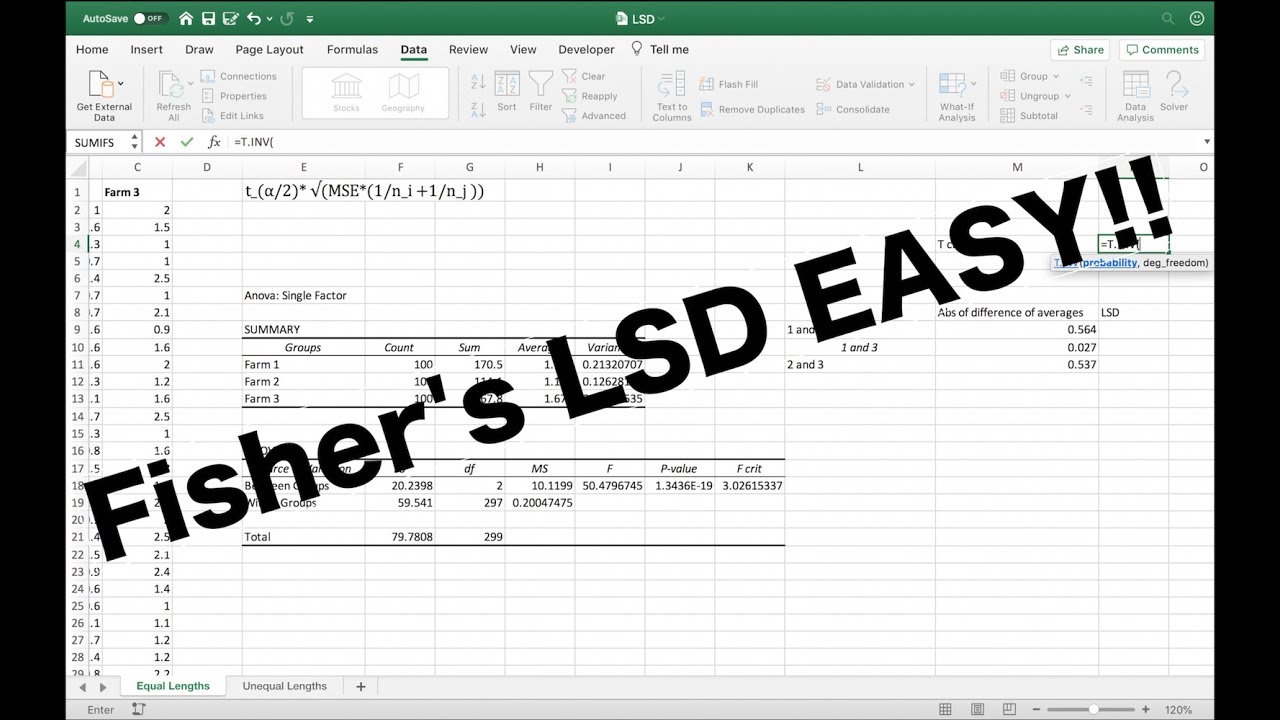
- 📝 The critical T value is determined using the T.INV.2T function in Excel, based on the chosen significance level and degrees of freedom.
- 🔢 T values for each pair comparison are calculated using the differences and the standard error of the difference.
- 🆚 The calculated T values are compared against the critical T value to determine if the differences between the roller coasters' wait times are statistically significant.
- 📈 Fisher's LSD threshold is calculated to further assess the significance of the differences using a conditional formula in Excel.
- 📊 The final conclusion drawn from the analysis is that all three pairwise comparisons of roller coaster wait times are statistically significant, indicating that their means are not equal.
Q & A
What is the main topic of the video?
-The main topic of the video is to demonstrate how to calculate Fisher's Least Significant Difference (LSD) test statistic and threshold using Excel, as a part of ANOVA post hoc analysis.
What is the purpose of creating a box plot for the roller coaster data?
-The purpose of creating a box plot is to visualize the data and to identify the differences in wait times among the roller coasters, which can help in determining which differences are statistically significant.
What is the significance of the mean wait times for the roller coasters as depicted in the box plot?
-The mean wait times in the box plot indicate that the Beast has the lowest wait time, Banshee has the middle wait time, and Diamondback has the highest wait time, providing a visual comparison of the wait times for statistical analysis.
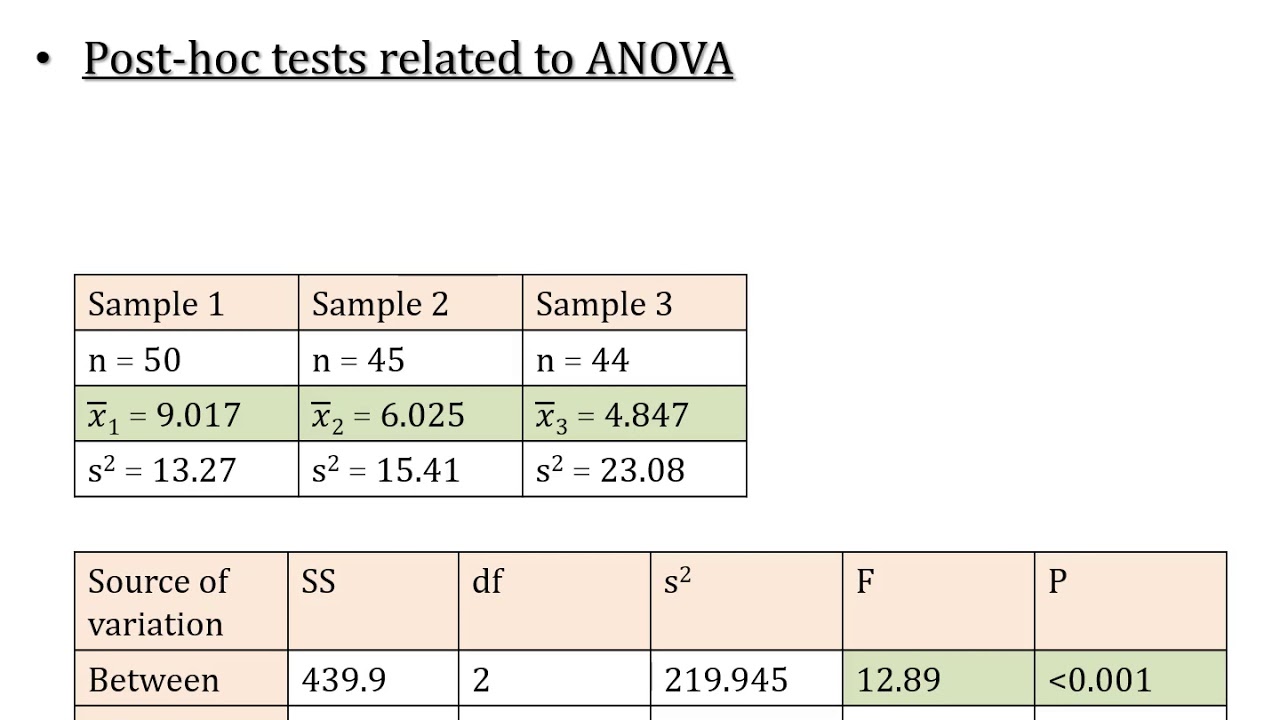
Why is it necessary to perform ANOVA post hoc analysis?
-ANOVA post hoc analysis is necessary to determine which pairwise differences between group means are statistically significant after finding an overall significant ANOVA result.
What are some alternative methods to Fisher's LSD test mentioned in the video?
-The alternative methods to Fisher's LSD test mentioned in the video are Tukey's, Bonferroni's, and Scheffé's tests, all of which serve the same purpose of multiple comparison in ANOVA.
Why is Fisher's LSD test chosen for demonstration in the video?
-Fisher's LSD test is chosen for demonstration because it is considered one of the easiest methods to perform and understand for teaching and learning about multiple comparison tests.
How does Excel assist in performing a one-way ANOVA?
-Excel assists by providing a built-in Data Analysis Toolpak that can calculate a one-way ANOVA, generating an ANOVA table with necessary statistics such as F value, P value, and mean square error.
What is the formula used to calculate the standard error of the difference between two means?
-The formula to calculate the standard error of the difference is the square root of the MSE (Mean Square Error from ANOVA) multiplied by (1/N_i + 1/N_j), where N_i and N_j are the sample sizes of the two groups being compared.
How is the critical T value determined for Fisher's LSD test?
-The critical T value is determined using the T.INV.2T function in Excel, which requires the chosen level of significance (alpha) and the degrees of freedom from the ANOVA results.
What does comparing the calculated T values to the critical T value signify in Fisher's LSD test?
-Comparing the calculated T values to the critical T value helps determine if the differences between the group means are statistically significant. If the T value is larger than the critical T value, the difference is considered significant.
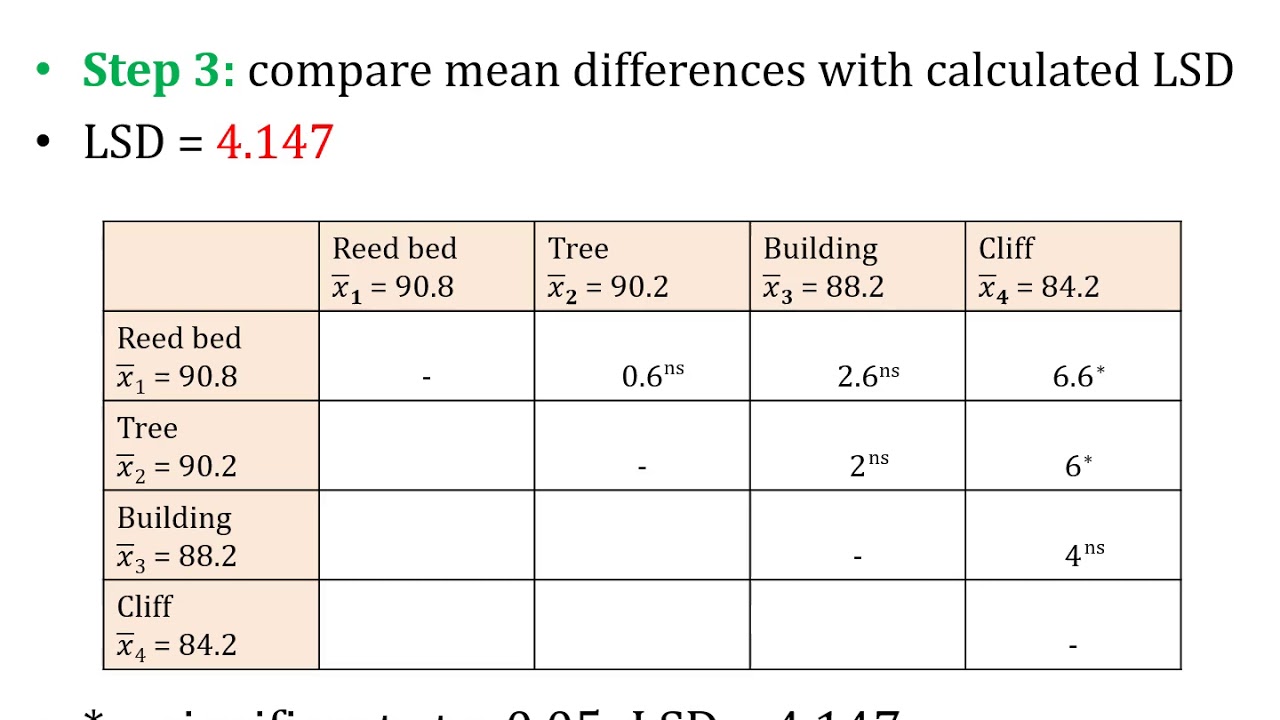
How does the video demonstrate the calculation of Fisher's LSD threshold?
-The video demonstrates the calculation of Fisher's LSD threshold by multiplying the critical T value by the standard error of the difference, which is then used to compare with the absolute value of the mean differences.
What conclusion can be drawn from the Fisher's LSD test in the video?
-The conclusion drawn from the Fisher's LSD test in the video is that all three pairwise differences in wait times among the roller coasters are statistically significant, indicating that their means are not equal to each other.
Outlines
📊 Introduction to Fisher's LSD Test in Excel
In this segment, Brandon introduces the video's focus on calculating Fisher's Least Significant Difference (LSD) test statistic and threshold using Excel. He references a previous video that discussed ANOVA post hoc analysis conceptually and suggests viewers watch it for context. The video also mentions a downloadable spreadsheet for hands-on learning. Brandon presents roller coaster wait time data from Kings Island amusement park, emphasizing the importance of visualizing data through box plots for ANOVA analysis. He guides viewers through creating a box plot in Excel, revealing differences in mean wait times among three roller coasters, and sets the stage for further statistical analysis to determine the significance of these differences.
🔍 Conducting ANOVA and Preparing for Fisher's LSD Test
This paragraph details the process of performing a one-way ANOVA using Excel's Data Analysis Toolpak. Brandon explains how to input data, select options, and interpret the resulting ANOVA table, which includes the F-value, P-value, and mean square error (MSE). He highlights the significance of the model and the importance of the MSE and degrees of freedom for subsequent calculations. The paragraph then moves on to calculating the differences in mean wait times between each pair of roller coasters, setting up the groundwork for the Fisher's LSD test. Brandon also introduces the concept of the standard error of the difference and demonstrates how to calculate it, which is crucial for determining the test statistic and the LSD threshold.
📐 Applying Fisher's LSD Test to Analyze Pairwise Differences
Brandon continues by applying Fisher's LSD test to the roller coaster data. He explains how to calculate the test statistic for each pair of roller coasters using the differences in mean wait times and the previously calculated standard error. The critical T-value is determined based on the chosen significance level and degrees of freedom. The paragraph demonstrates how to compute T values for each pair and compares them to the critical T-value to assess statistical significance. Additionally, Brandon introduces the concept of the LSD threshold and shows how to calculate it. He then compares the absolute value of the differences to the LSD threshold to conclude which pairwise differences are significant, reinforcing the statistical significance of the differences between the roller coasters' wait times.
📈 Conclusion and Summary of Statistical Significance
In the final paragraph, Brandon summarizes the findings from the Fisher's LSD test, confirming that all three pairwise comparisons of roller coaster wait times are statistically significant. He reiterates the process of using both the test statistic method and the LSD threshold method to arrive at this conclusion. The video concludes with a visual representation of the data, emphasizing the differences between the roller coasters. Brandon expresses hope that the video was informative and provides a clear understanding of how to extend Excel's ANOVA capabilities for multiple comparison tests using Fisher's LSD. He looks forward to the next video in the series, ending with a farewell.
Mindmap
Keywords
💡Fisher's LSD test
💡ANOVA
💡Post hoc analysis
💡Box plot
💡Mean wait time
💡Statistical significance
💡Excel
💡Data Analysis Toolpack
💡Degrees of freedom
💡T statistic
💡Critical T value
💡Standard error
💡Conditional formulas
Highlights
Introduction to calculating Fisher's LSD test statistic and threshold in Excel, following a conceptual overview in a previous video.
Recommendation to watch a previous video for understanding ANOVA post hoc and multiple comparison procedures before proceeding.
Availability of a downloadable spreadsheet for following along with the video content.
Visualization of roller coaster wait time data from Kings Island amusement park using a box plot.
Identification of the Beast with the lowest mean wait time and Diamondback with the highest.
Explanation of the need for post hoc analysis to determine the statistical significance of differences between mean wait times.
Introduction of Fisher's LSD test as the chosen method for post hoc analysis, among other alternatives like Tukey, Bonferroni, and Scheffé's test.
Absence of a built-in Fisher's LSD procedure in Excel and the approach to calculate it manually.
Use of Excel's Data Analysis Toolpack for calculating a one-way ANOVA.
Importance of selecting 'Labels in first row' for accurate ANOVA results.
Interpretation of the ANOVA table results, including significance indicated by a very small P value and a high F value.
Calculation of the differences between each pair of roller coasters' mean wait times.
Explanation of the standard error of the difference and its role in both the T statistic and LSD formula.
Determination of the critical T value based on the chosen level of significance and degrees of freedom.
Calculation of T values for each pair of roller coasters using the Fisher's LSD test statistic formula.
Comparison of calculated T values to the critical T value to determine statistical significance.
Introduction of Fisher's LSD threshold calculation and its comparison with the absolute value of differences.
Use of conditional formulas in Excel to determine if differences are significant based on the LSD threshold.
Conclusion that all three pairwise comparisons of roller coaster wait times are statistically significant.
Demonstration of the practical application of Excel for conducting a multiple comparison test using Fisher's LSD.
Transcripts
Browse More Related Video
One-Way ANOVA with LSD (Least Significant Difference) Post Hoc Test in Excel

Statistics 101: ANOVA Post Hoc Test (Fisher's LSD)
Fisher's LSD Explained
LSD; Least Significant Difference; Post Hoc Test of ANOVA; Comparison of Means (Part A)
LSD; Least Significant Difference; Post Hoc Test of ANOVA; Comparison of Means (Part B)
Tukey-Kramer Post Hoc Test after One-Way ANOVA in Excel
5.0 / 5 (0 votes)
Thanks for rating: