Mean, Median and Mode of Grouped Data(Lesson 2)
TLDRThis tutorial video instructs viewers on calculating the mean, median, and mode of grouped data, specifically scores from an aptitude test. It demonstrates the process of finding the mean using the formula for grouped data, identifying the median class and calculating the median score, and determining the mode by comparing class frequencies. The video provides step-by-step calculations, including creating a new row for mid-values and adjusting formulas for data arranged in descending order, ensuring a comprehensive understanding of statistical measures.
Takeaways
- 📊 The video tutorial focuses on calculating the mean, median, and mode of grouped data in a statistical context.
- 📈 The data provided is arranged in descending order, which is different from the first video where data was in ascending order.
- 🔢 To calculate the mean, a new row for the mid-value (X) of class intervals is created, and the formula used is the sum of frequency times X divided by the sum of frequency.
- 📝 The mean score is calculated to be 30.5 by summing the product of frequency and mid-value and dividing by the total frequency.
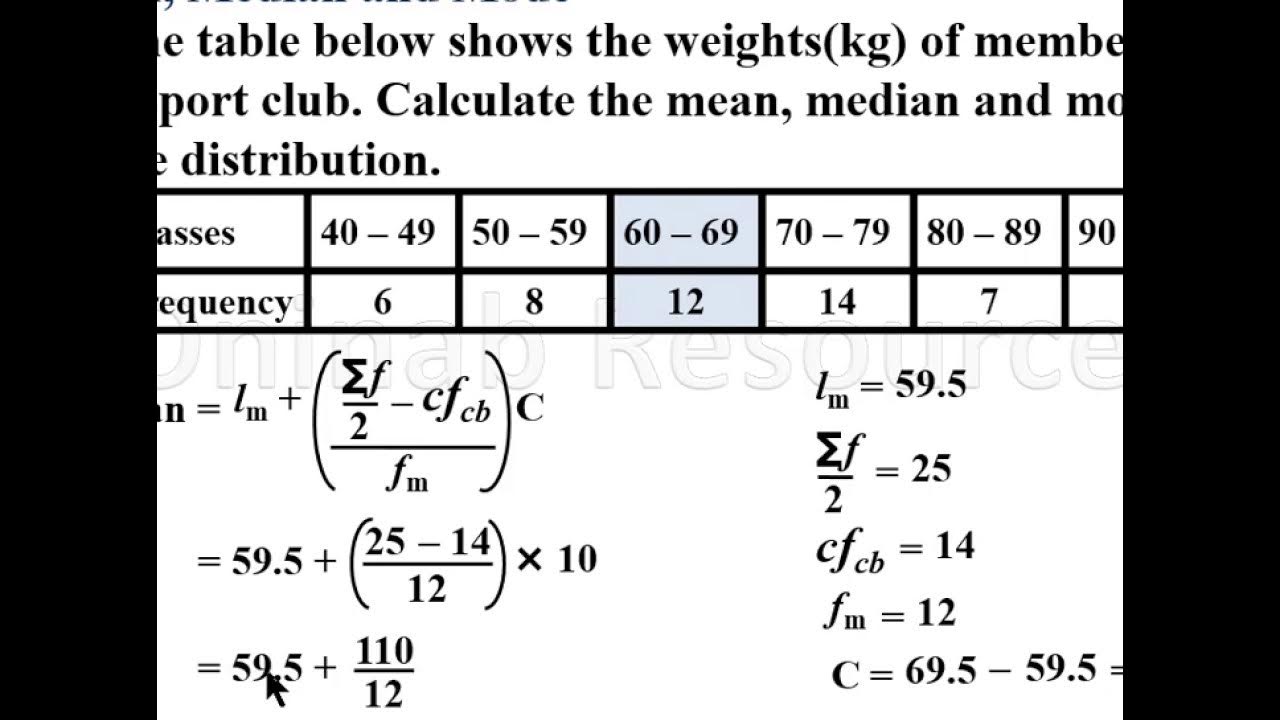
- 🔍 For the median, the formula involves finding the median class, which contains the 20th and 21st scores in this case, and is within the 31-40 score range.
- 📐 The lower class boundary of the median class is determined by averaging the lower and upper limits of the class interval.
- 📊 The median is calculated using the formula that accounts for the cumulative frequency, the frequency of the median class, and the class width.
- 🔢 The median score is found to be 31.5 by applying the formula for median calculation.
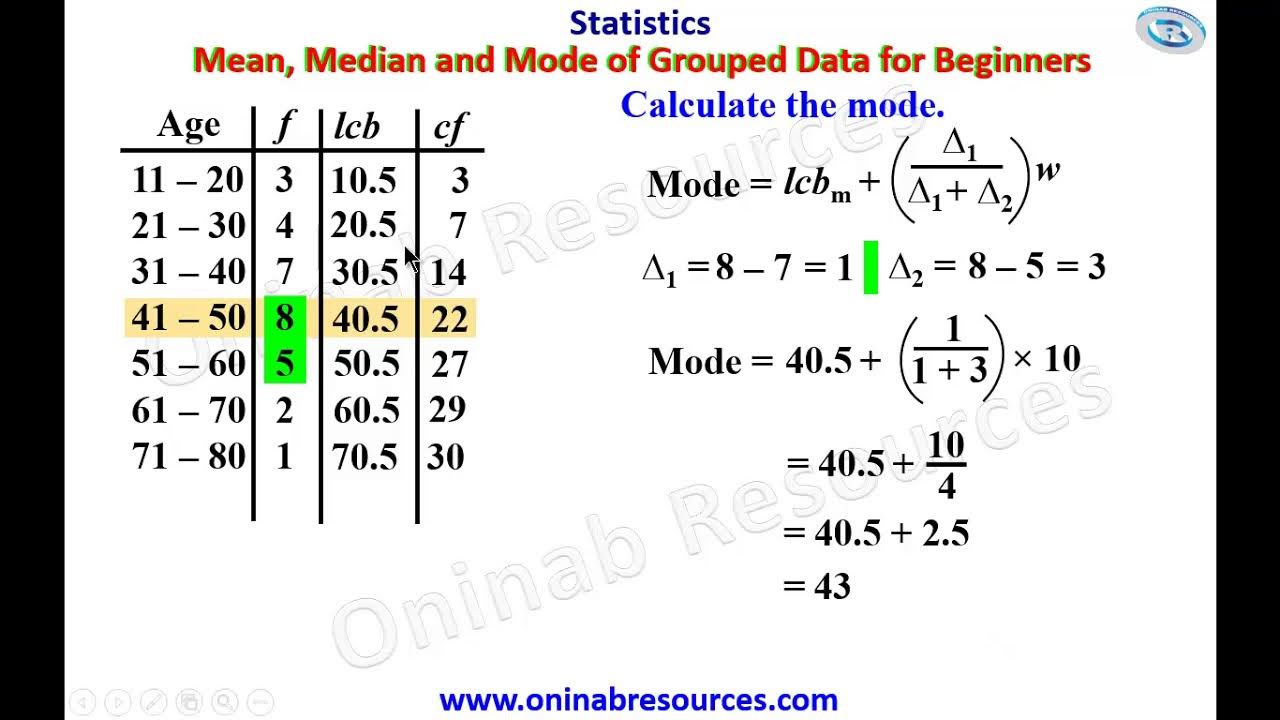
- 📈 The mode is identified by the class with the highest frequency, which is the same as the median class in this scenario.
- 📏 The mode is calculated using the formula that involves the lower class boundary, differences in frequencies (Delta 1 and Delta 2), and the class width.
- 📝 The mode of the distribution is determined to be 34.5 by applying the mode calculation formula.
Q & A
What is the main topic of the video tutorial?
-The main topic of the video tutorial is the calculation of mean, median, and mode of grouped data in statistics.
How is the data in the problem arranged, and how does it affect the calculation?
-The data is arranged in descending order, which affects the calculation as it requires identifying the median and mode by considering the frequencies from the highest to the lowest class intervals.
What is the formula used to calculate the mean of grouped data?
-The formula used to calculate the mean of grouped data is the summation of the product of the mid-value of each class interval (X) and their respective frequencies (f), divided by the total frequency (Σf).
How is the mid-value of a class interval calculated?
-The mid-value of a class interval is calculated by adding the lower and upper limits of the interval and dividing by 2.
What is the formula for calculating the median of grouped data?
-The formula for calculating the median involves finding the lower class boundary of the median class (LM), the cumulative frequency after the median class (CF), and the frequency of the median class (f), and then using these values to estimate the median score.
How do you determine the median class in the data?
-The median class is determined by finding the class interval that contains the 20th and 21st scores when the total number of scores (40) is divided by 2.
What is the class width, and how is it used in the calculation of the median?
-The class width is the difference between the upper and lower limits of a class interval. It is used in the calculation of the median to estimate the position of the median scores within the median class.
What formula is used to calculate the mode of grouped data?
-The formula for calculating the mode involves the lower class boundary of the modal class (LM), the difference in frequency between the modal class and the class before it (Δ1), and the difference in frequency between the modal class and the class after it (Δ2), all multiplied by the class width (W).
How do you identify the modal class in the data?
-The modal class is identified by finding the class interval with the highest frequency.
What is the final calculated mean, median, and mode for the given distribution in the tutorial?
-The final calculated mean is 30.5, the median is 31.5, and the mode is 34.5 for the given distribution.
Outlines
📊 Introduction to Calculating Mean, Median, and Mode of Grouped Data
This paragraph introduces the tutorial on calculating the mean, median, and mode of grouped data. It discusses the arrangement of data in descending order and the need to calculate these statistical measures. The tutorial begins with the formula for the mean, which is the sum of the product of the mid-values of class intervals (X) and their frequencies (f) divided by the total frequency. The process includes creating a new row for X, calculating the mid-values, and then the product of X and f (FX). The mean is found by dividing the sum of FX by the total frequency.
🔢 Calculating the Median of Grouped Data in Descending Order
The second paragraph delves into calculating the median of the distribution. It explains the process of finding the median class by determining the cumulative frequency and identifying the class interval that contains the median score. The lower class boundary of the median class is calculated, and the cumulative frequency up to the class before the median class is determined. The class width is also calculated. Using these values, the median is estimated by applying the formula that accounts for the position of the median within the class interval.
📈 Determining the Mode of Grouped Data with the Highest Frequency
The final paragraph focuses on calculating the mode of the distribution. It describes identifying the modal class with the highest frequency and the process of calculating the mode using the lower class boundary of the modal class, the class width, and the differences in frequency (Delta 1 and Delta 2) relative to adjacent classes. The mode is estimated by applying the formula that incorporates these elements to find the value that occurs most frequently in the dataset.
Mindmap
Keywords
💡Statistics
💡Grouped Data
💡Mean
💡Median
💡Mode
💡Class Intervals
💡Frequency
💡Cumulative Frequency
💡Class Width
💡Descending Order
💡Tutorial
Highlights
Introduction to the tutorial on calculating mean, median, and mode of grouped data.
Explanation of the problem involving scores out of 60 from an aptitude test.
Description of the data arrangement in descending order, from highest to lowest class.
Introduction of the mean formula using the summation of frequency times the mid-value of class intervals.
Calculation of the mid-value for each class interval to find the mean.
Explanation of creating a column for the product of frequency and mid-value (FX).
Summation of FX values and frequencies to calculate the mean score of 30.5.
Introduction to the median calculation formula and its components.
Identification of the median class containing the 20th and 21st scores.
Calculation of the lower class boundary of the median class as 30.5.
Determination of the cumulative frequency and frequency of the median class.
Explanation of calculating the class width and using it in the median formula.
Final calculation of the median score as 31.5.
Introduction to the mode calculation formula and its parameters.
Identification of the modal class with the highest frequency.
Calculation of the lower class boundary, Delta 1, Delta 2, and class width for mode.
Final calculation of the mode score as 34.5.
Conclusion summarizing the calculated mean, median, and mode of the distribution.
Call to action for viewers to subscribe to the YouTube channel.
Transcripts
Browse More Related Video
Measure of Central Tendency of Grouped Data for beginners
Mean, median and mode of grouped Data(Lesson 1)

Statistics of Grouped Data: Mean, Median and Mode
Measures of Central Tendency (Grouped Data) | Basic Statistics

Statistics - Mean, Median & Mode for a grouped frequency data
Mean, median, mode of Ungrouped Data
5.0 / 5 (0 votes)
Thanks for rating: