Statistics of Grouped Data: Mean, Median and Mode
TLDRThe video script offers a comprehensive guide on calculating the mean, median, and mode for grouped data, using a sports club's member weights as an example. It explains the process of reorganizing data into a vertical form, determining class intervals, and calculating the mid-values. The script then methodically works through the formulas for mean, median, and mode, providing clear steps and calculations, leading to the final results of 67.9 for the mean, 68.6 for the median, and 77.2 for the mode.
Takeaways
- 📊 To calculate the mean for grouped data, use the formula: Σ(FX) / Σf, where F represents the frequency and X the midpoint of class intervals.
- 📈 The midpoint of each class interval is found by averaging the upper and lower limits (e.g., (40+49)/2 = 44.5).
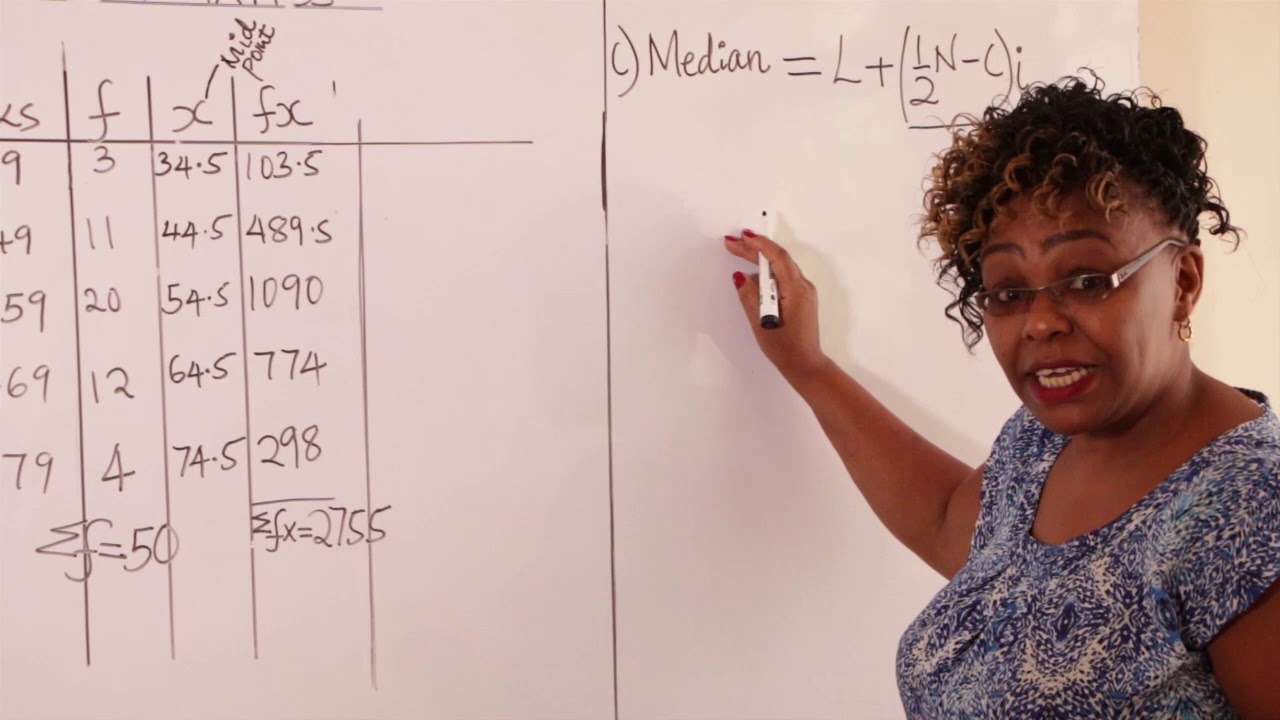
- 🔢 For the median, the formula involves identifying the median class based on the total number of data points and cumulative frequencies (Σf/2).
- 🏆 The median class is determined by the position of the middle data points in the ordered list (e.g., 25th and 26th for 50 members).
- 📝 The lower class boundary of the median class is calculated by taking the midpoint between the lower limit of the median class and the upper limit of the previous class.
- 🔄 Cumulative frequency is the sum of all frequencies before the median class, which helps in finding the median.
- 📊 To find the mode, identify the class with the highest frequency, which represents the modal class.
- 🔢 The mode's formula involves the lower class boundary of the modal class (LM), differences in frequencies (Δ1 and Δ2), and the class size (C).
- 📊 The class size (C) is the difference between the upper and lower class boundaries of the modal class.
- 🎯 The mode calculation uses LM, Δ1, Δ2, and C to find the mode's midpoint, representing the most frequent value in the data set.
- 📝 The process of reorganizing the data from horizontal to vertical form is crucial for accurate calculation of statistical measures for grouped data.
Q & A
What are the three measures of central tendency discussed in the transcript?
-The three measures of central tendency discussed are mean, median, and mode.
How is the mean calculated for grouped data?
-The mean for grouped data is calculated using the formula: Σ(FX) divided by the total frequency, where F represents the frequency and X the midpoint of the class intervals.
What is the midpoint of a class interval?
-The midpoint of a class interval is found by averaging the upper and lower limits of the interval.
How do you find the median class for a set of data?
-To find the median class, you arrange the data in ascending order and determine the class that contains the middle value(s) based on the total number of data points.
What formula is used to calculate the median for grouped data?
-The median for grouped data is calculated using the formula: Lower class boundary of the median class + (Sum of frequencies / 2 - cumulative frequency of the class before the median class) * class width.
How do you identify the mode in a set of grouped data?
-The mode is identified by finding the class with the highest frequency, and this class is considered the modal class.
What is the formula for calculating the mode for grouped data?
-The mode for grouped data is calculated using the formula: Lower class boundary of the modal class * (frequency of the modal class - frequency of the class before it + frequency of the class after it) / (frequency of the modal class + frequency of the class after it) * class width.
What is the class width in the context of the transcript?
-The class width, or class size, refers to the difference between the upper and lower class boundaries of a class interval.
How do you calculate the cumulative frequency for the classes before the median class?
-The cumulative frequency for the classes before the median class is calculated by summing the frequencies of all the classes that come before the median class in the arranged data set.
What is the purpose of calculating the mean, median, and mode for a data set?
-Calculating the mean, median, and mode helps in understanding the central tendency of a data set, providing insights into the typical values and the distribution of the data points around these measures.
How does the process of calculating the mean for grouped data differ from that of ungrouped data?
-For ungrouped data, the mean is calculated directly by summing all data points and dividing by the number of points. For grouped data, you must first calculate theFX (frequency times the midpoint of the class interval) for each class, then sum these products and divide by the total frequency to find the mean.
Outlines
📊 Calculating Mean, Median, and Mode for Grouped Data
This paragraph introduces the process of calculating the mean, median, and mode for grouped data. It explains the need to reorganize the data into a vertical form to calculate the mean using the formula (sum of FX / sum of f). The paragraph details the creation of a new column for X, representing the mid-value of class intervals, and the method to find these mid-values. It then describes how to calculate FX (frequency times X) and the sum of frequencies to find the mean. The paragraph concludes with the calculated mean of 67.9 for the given distribution.
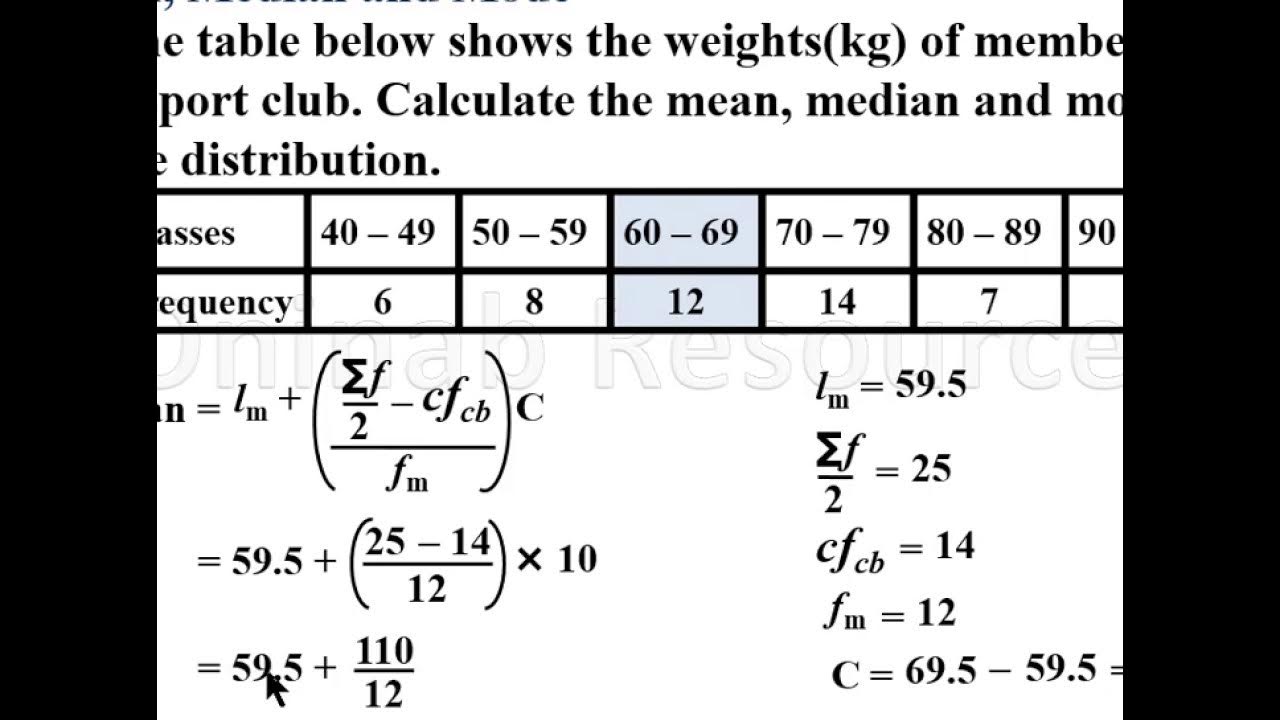
🔍 Finding the Median in Grouped Data
This paragraph focuses on the method to find the median in grouped data. It outlines the formula for the lower class boundary of the median class and explains how to identify the median class by arranging the data in ascending order and determining the middle values. The paragraph details the calculation of the lower class boundary and the cumulative frequency before the median class. It concludes with the calculation of the median, which is found to be 68.6, by applying the formula using the lower class boundary, cumulative frequency, and class size.
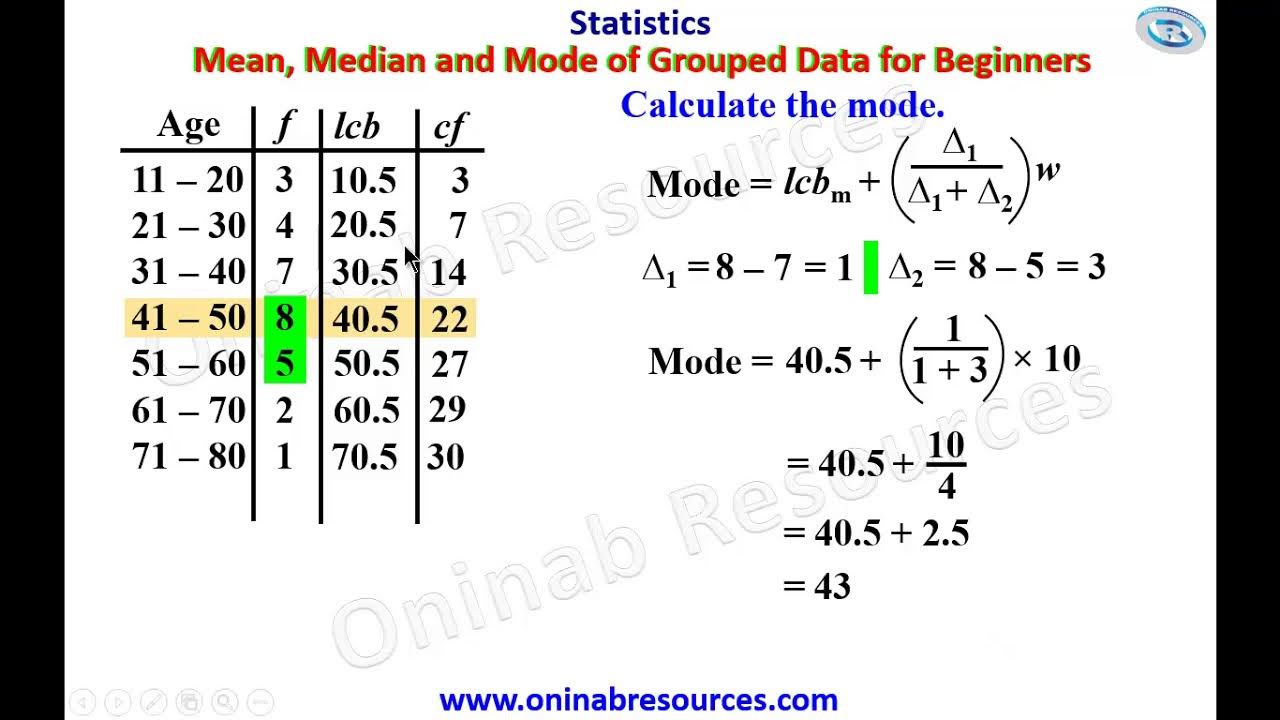
🏆 Determining the Mode of Grouped Data
The final paragraph discusses the process of determining the mode for grouped data. It explains how to identify the modal class with the highest frequency. The paragraph then describes the calculation of the lower class boundary of the modal class and the differences in frequency before and after the modal class. The mode is calculated using the formula (LM + (Δ1 + Δ2)/C), where LM is the lower class boundary, Δ1 and Δ2 are the differences in frequencies, and C is the class size. The paragraph concludes with the calculated modal class of 7.72 for the distribution.
Mindmap
Keywords
💡mean
💡median
💡mode
💡class interval
💡frequency
💡mid-value
💡cumulative frequency
💡grouped data
💡frequency distribution table
💡descriptive statistics
💡class width
Highlights
The video teaches how to calculate the mean, median, and mode of grouped data.
The data provided is for the weights of members in a sports club, presented in a table.
To calculate the mean, the table needs to be reorganized into a vertical form with class intervals and mid-values.
The mid-value of a class interval is calculated as the average of the upper and lower limits.
The formula for calculating the mean involves summing the product of frequency and mid-value, divided by the total frequency.
The median is found by identifying the middle values in the ordered data set and calculating the lower class boundary of the median class.
The mode is determined by finding the class with the highest frequency and using a specific formula to calculate the modal class.
The mean is calculated as 67.9, derived from the sum of the product of frequencies and mid-values.
The median is calculated to be 68.6, using the lower class boundary and cumulative frequencies.
The mode of the distribution is 7.72, found by applying the mode formula to the modal class.
The process involves converting horizontal data into a vertical format with class intervals for analysis.
The calculation of the mean requires generating a new column for the mid-value of class intervals.
Cumulative frequencies are used to determine the median class and its position within the data set.
The lower class boundary of the median class is calculated by finding the midpoint between the lower and upper limits.
The class size or width is calculated by finding the difference between the upper and lower class boundaries.
The modal class is identified by the highest frequency within the data set.
The mode calculation involves differences in frequencies and class sizes to find the modal value.
Transcripts
Browse More Related Video
Mean, median and mode of grouped Data(Lesson 1)
Mean, Median and Mode of Grouped Data(Lesson 2)

Statistics - Mean, Median & Mode for a grouped frequency data
Measure of Central Tendency of Grouped Data for beginners
Measures of Central Tendency (Grouped Data) | Basic Statistics
FORM 2 MATHS STATISTICS I MEAN,MODE & MEDIAN
5.0 / 5 (0 votes)
Thanks for rating: