Statistics - Mean, Median & Mode for a grouped frequency data
TLDRThis video script offers a comprehensive guide on calculating central tendencies for grouped frequency data, focusing on mean, median, and mode. It explains the process of determining class marks and using them to calculate the mean of defective bulbs in boxes. The script also demonstrates how to find the median through cumulative frequency and the mode by identifying the class with the highest frequency. The session provides a clear understanding of statistical principles with practical examples, making it an engaging and informative resource for students.
Takeaways
- 📚 The session is a continuation of a statistics course, focusing on the calculation of central tendencies for grouped data.
- 💡 Central tendencies discussed include mean, median, and mode, which are essential concepts in understanding data distribution.
- 🔢 The mean is calculated by multiplying the class mark by the frequency and then summing these products, dividing by the total number of groups.
- 📊 The class mark is the central value of a class interval, representing the average for that range of data.
- ⚖️ The mean of the number of defective bulbs in boxes is found to be 4.3, rounded to 4, indicating an average of four defective bulbs per box.
- 📈 Median is the middle value of a dataset and is calculated using cumulative frequency to find the central position in the data.
- 🔑 Cumulative frequency is the running total of frequencies from the lowest to the highest class interval.
- 🎯 The median is determined by finding where the cumulative frequency crosses the midpoint of the total number of observations.
- 📌 The mode is the value that appears most frequently in a dataset and is straightforward to identify in grouped data.
- 📐 The mode is calculated using the formula involving the lower limit of the modal class, frequencies of adjacent classes, and class width.
- 📝 The session concludes with a clear explanation of how to calculate mean, median, and mode for grouped frequency data, providing practical examples.
Q & A
What are the central tendencies discussed in the session?
-The central tendencies discussed in the session are mean, median, and mode.
What is the purpose of calculating the mean for the number of defective bulbs in the given example?
-The purpose is to find the average number of defective bulbs per box, which helps in understanding the general quality of the bulbs across different boxes.
How is the class mark calculated in the context of the given data?
-The class mark is the central value of the class interval. For example, for the interval 0 to 2, the class mark is 1, which is the midpoint of the interval.
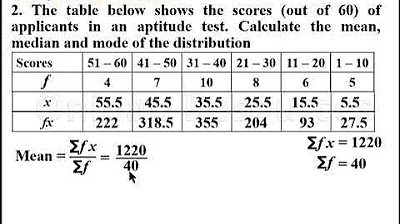
What is the formula used to calculate the mean from grouped frequency data?
-The mean is calculated using the formula: Mean = (Summation of f*x) / Total number of boxes, where f is the frequency and x is the class mark.
What is the result of the mean calculation for the number of defective bulbs in the example?
-The calculated mean is 4.3, which is then rounded to 4 to represent the average number of defective bulbs per box.
What is the definition of median in the context of the data provided?
-Median is the centermost value of the observations, representing the middle score when the data is arranged in ascending order.
How is the cumulative frequency used in calculating the median?
-Cumulative frequency is used to find the point at which the total number of observations is halfway. It helps in identifying the median class and calculating the median value.
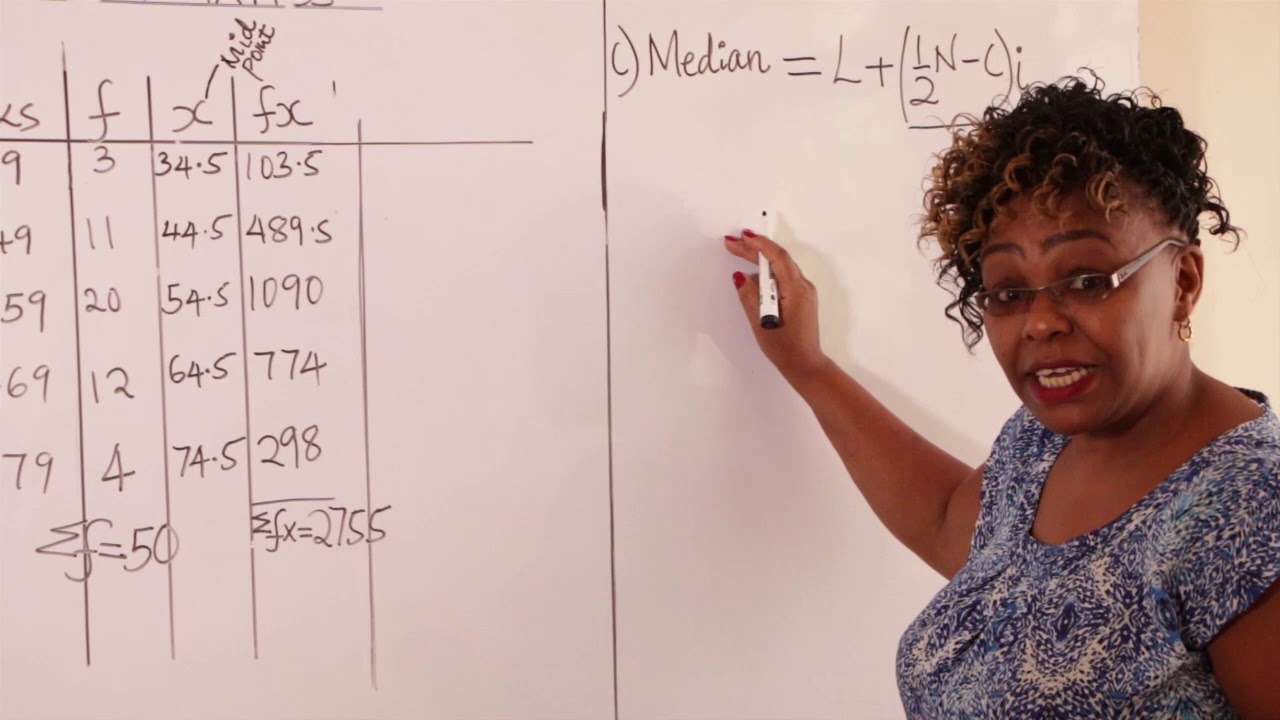
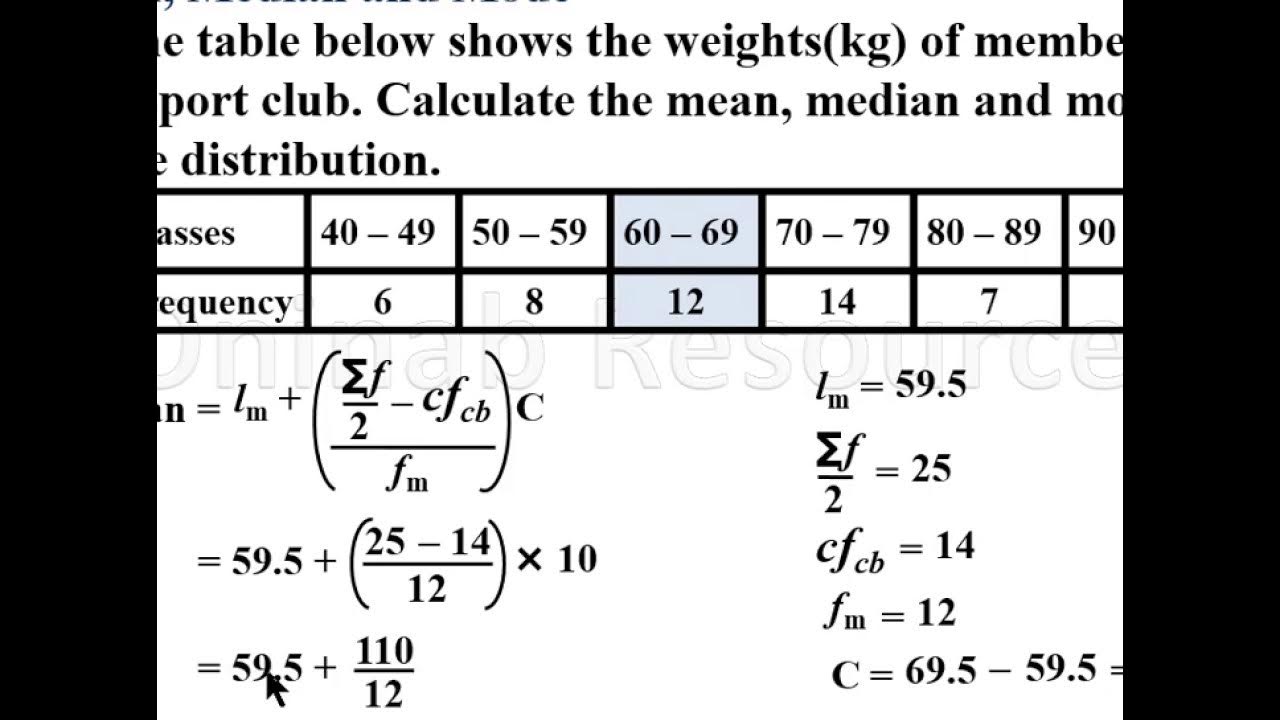
What is the formula for calculating the median from grouped frequency data?
-The median is calculated using the formula: Median = L + [(N/2 - CF) / F] * H, where L is the lower limit of the median class, N is the total number of observations, CF is the cumulative frequency of the previous class, F is the frequency of the median class, and H is the class width.
What is the result of the median calculation in the example?
-The calculated median is 32, which represents the middle value of the scores.
How is the mode defined in the context of the data provided?
-Mode is the value that occurs the maximum number of times in a data set, representing the most common score or value.
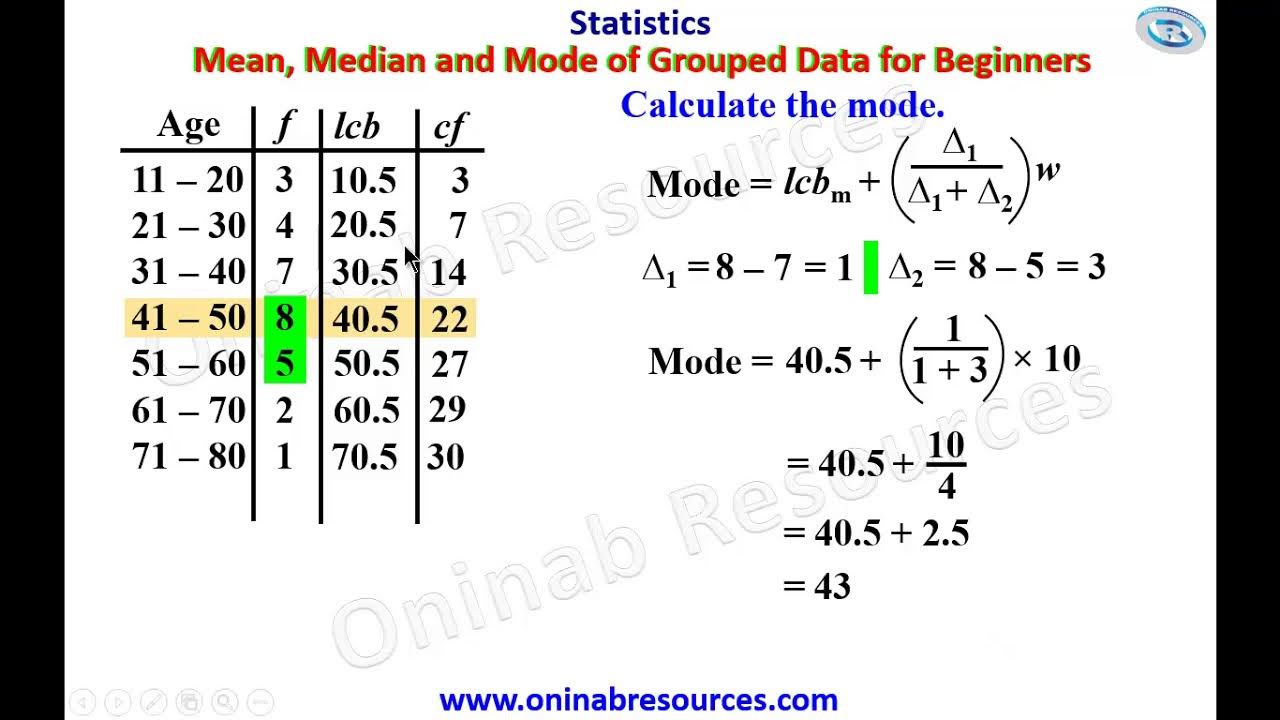
What is the formula for calculating the mode from grouped frequency data?
-The mode is calculated using the formula: Mode = L + [(f1 - f0) / (2f1 - f0 - f2)] * H, where L is the lower limit of the modal class, f1 is the frequency of the modal class, f0 is the frequency of the previous class, f2 is the frequency of the next class, and H is the class width.
What is the result of the mode calculation in the example?
-The calculated mode is 25, indicating that this is the most common score among the students.
Outlines
📊 Calculating Central Tendencies for Grouped Data
This paragraph introduces the second session of a statistics course, following an initial session on water statistics. The focus is on calculating central tendencies such as mean, median, and mode for a larger set of data, specifically the average number of defective bulbs in boxes. The example provided illustrates how to determine the class mark and calculate the mean by multiplying the class mark by frequency and dividing by the total number of boxes. The mean is found to be 4.3, which is then rounded to the nearest whole number since defects cannot be fractional. The process also touches on the concept of class intervals and the importance of the class mark as the central value of a class.
📈 Understanding Median and Mode Calculations in Grouped Data
The second paragraph delves into the calculation of the median and mode for grouped frequency data. The median is explained as the middle value of observations, requiring the use of cumulative frequency to identify the central value. The example uses student scores to demonstrate how to find the median class and apply the formula for calculating the median, resulting in a median score of 32. The mode, the most frequently occurring value, is calculated using a simple formula that takes into account the frequencies of the modal class and adjacent classes, as well as the class width. The mode is determined to be 25, marking the score range with the highest student frequency. The paragraph concludes by summarizing the methods for calculating mean, median, and mode for grouped data, providing a comprehensive understanding of these statistical measures.
Mindmap
Keywords
💡Statistics
💡Central Tendencies
💡Mean
💡Median
💡Mode
💡Defective Bulbs
💡Class Interval
💡Class Mark
💡Frequency
💡Cumulative Frequency
💡Grouped Frequency Data
Highlights
Introduction to the second session of statistics, building upon the previous session's discussion of water statistics and central tendencies.
Explanation of basic principles, including the concepts of mean, median, and mode.
Transition to calculating central tendencies for a larger dataset, specifically the number of defective bulbs in boxes.
Description of the data range for defective bulbs, from 0 to 10, and the implication for the average calculation.
Introduction of the concept of class intervals and the need to calculate class marks for grouped data.
Calculation of class marks as central values for each class interval.
Method to calculate the mean by multiplying class marks with frequencies and dividing by the total number of boxes.
Result of the mean calculation, revealing an average of 4.3 defective bulbs per box, rounded to four.
Introduction to the concept of median as the centermost value in a dataset.
Explanation of cumulative frequency and its role in determining the median.
Process of identifying the median class by finding where the cumulative frequency crosses a specific value.
Formula for calculating the median using lower limit, cumulative frequency, and class width.
Calculation of the median resulting in a value of 32, based on the provided formula.
Introduction to mode as the value that occurs most frequently in a dataset.
Explanation of how to calculate mode using the formula involving frequencies of adjacent classes and class width.
Result of the mode calculation, determining the mode to be 25 based on the given data.
Summary of the session, covering the calculation of mean, median, and mode for grouped frequency data.
Transcripts
Browse More Related Video
FORM 2 MATHS STATISTICS I MEAN,MODE & MEDIAN
Measure of Central Tendency of Grouped Data for beginners
Mean, Median and Mode of Grouped Data(Lesson 2)
Mean, median and mode of grouped Data(Lesson 1)
Measures of Central Tendency (Grouped Data) | Basic Statistics

Statistics of Grouped Data: Mean, Median and Mode
5.0 / 5 (0 votes)
Thanks for rating: