How To Perform A One-Way ANOVA Test In Excel
TLDRThis tutorial video guides viewers on how to perform a one-way ANOVA using Microsoft Excel. It covers installing the Analysis Toolpak, inputting data, selecting options, and interpreting results. The presenter explains the significance of the F-statistic, p-value, and the implications of the test's outcome, including the need for post-hoc tests to identify specific group differences. The video concludes with an invitation for feedback and further learning.
Takeaways
- 📘 The tutorial demonstrates how to perform a one-way ANOVA using Microsoft Excel, including the test execution and result analysis.
- 🔍 The presenter uses data from three different groups on their performance in a vertical jump test, with 15 participants in each group.
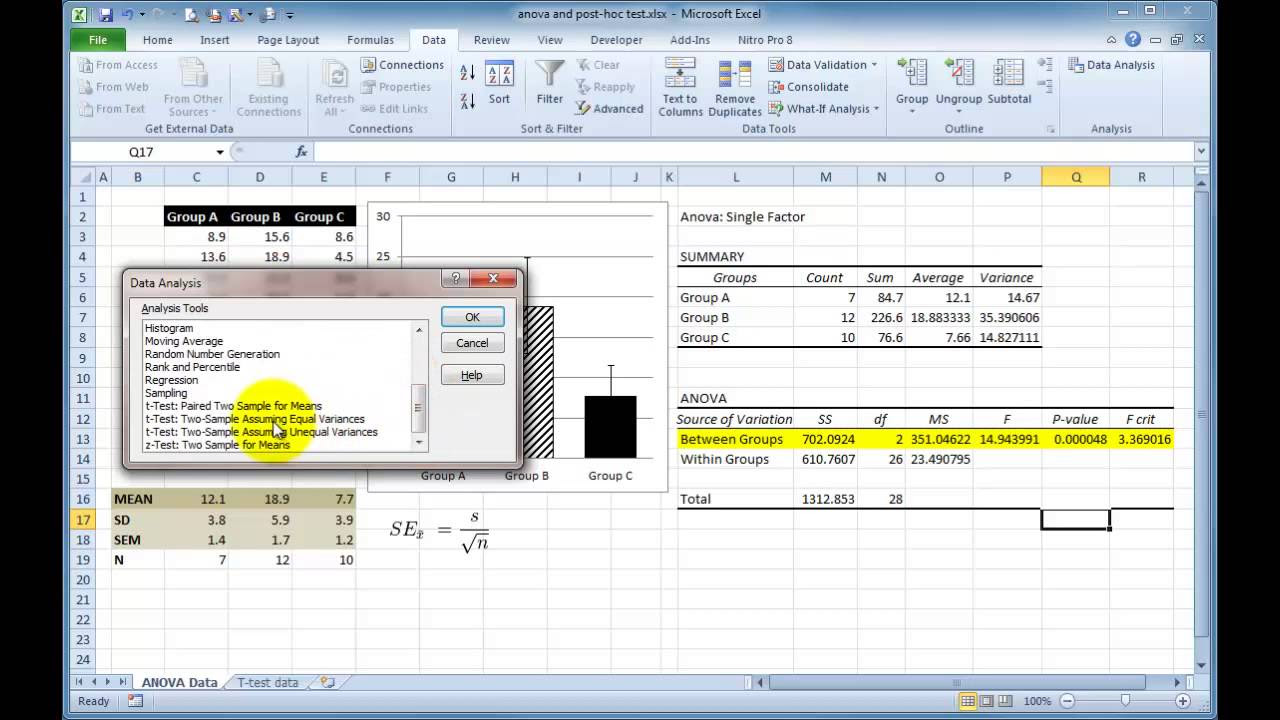
- 🛠️ To perform the one-way ANOVA in Excel, the Analysis ToolPak add-on must be activated, which provides statistical analysis tools.
- 📊 The input range for the ANOVA test includes all data points, and the data should be grouped by columns if each group's data is in a separate column.
- 🎯 The alpha level, typically set at 0.05, determines the significance threshold for the test.
- 📑 Output options for the ANOVA results include placing them in a specified range, on a new worksheet, or in a separate Excel file.
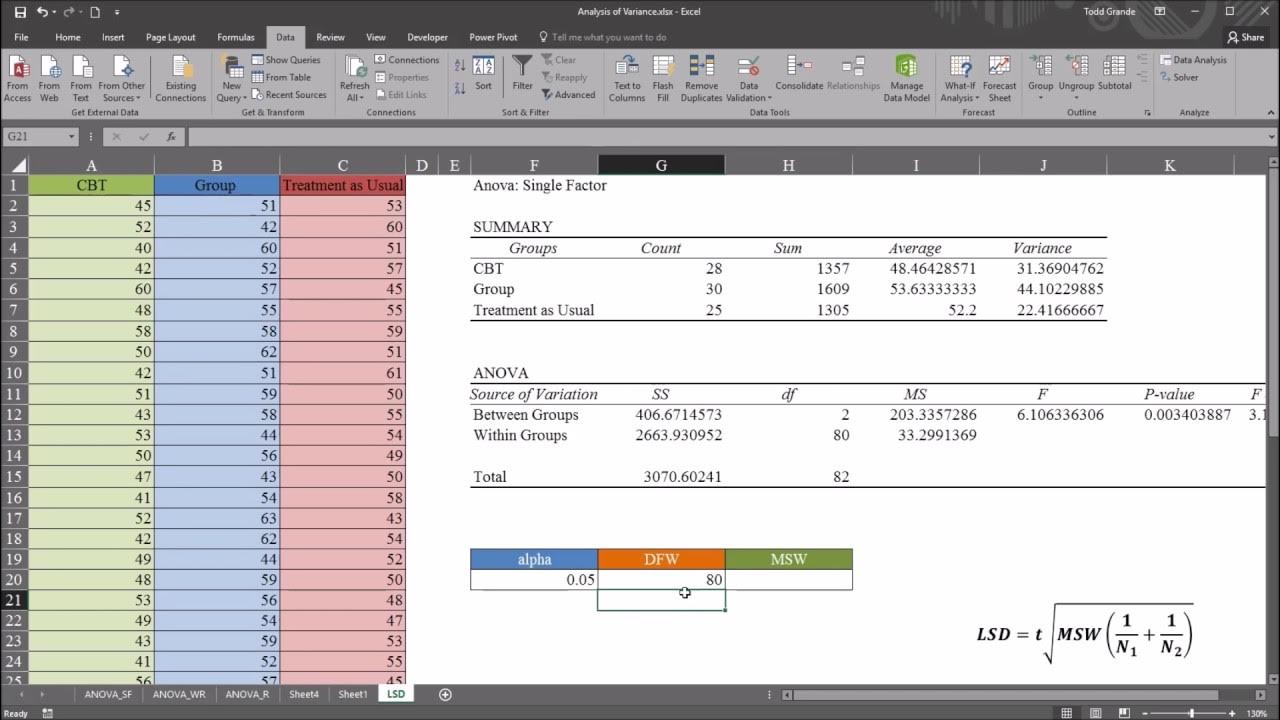
- 📈 The ANOVA summary table provides a count, sum, average, and variance for each group.
- 📊 SS (Sum of Squares) measures variability, with separate calculations for between groups and within groups.
- 🔢 Degrees of Freedom (df) are calculated differently for between and within groups, affecting the mean square (MS) calculation.
- 📉 The F-statistic is the test statistic for ANOVA, calculated as the ratio of the mean square between groups to the mean square within groups.
- 🔑 The p-value, compared with the alpha level, determines the significance of the test results, with a value less than or equal to 0.05 indicating a significant difference between group means.
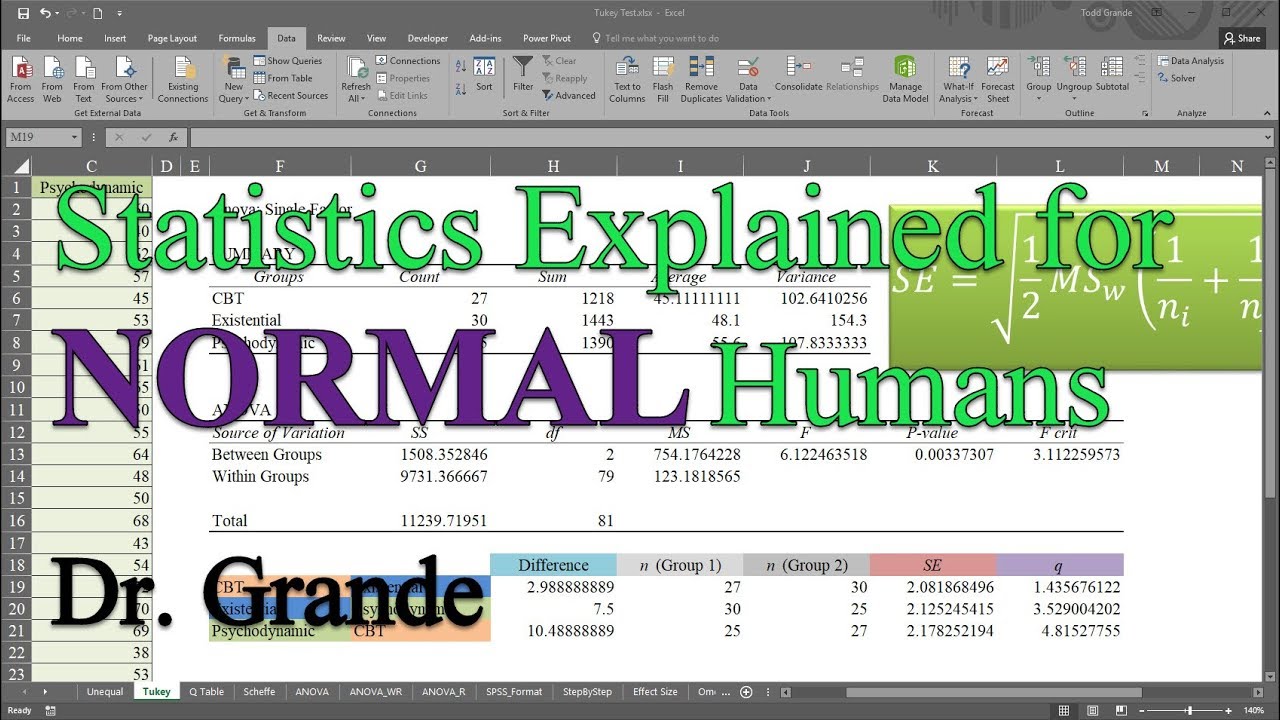
- 🚀 If the ANOVA test is significant, post hoc tests like Tukey, Bonferroni, or Holmes's can be used to identify specific group differences, which will be covered in future tutorials.
Q & A
What is the purpose of the video tutorial?
-The purpose of the video tutorial is to demonstrate how to perform a one-way analysis of variance (ANOVA) using Microsoft Excel, including conducting the test and interpreting the results.
What is a one-way ANOVA test used for?
-A one-way ANOVA test is used to determine if there is a significant difference between the average values of three or more independent groups.
What is the 'Analysis ToolPak' and why is it needed for the one-way ANOVA in Excel?
-The 'Analysis ToolPak' is an add-on created by Microsoft that provides data analysis tools for statistical analyses. It is needed for the one-way ANOVA in Excel because it includes the necessary functionality to perform this statistical test.
How can you install the 'Analysis ToolPak' in Excel?
-To install the 'Analysis ToolPak', go to 'File' > 'Options', click on 'Add-Ins' at the bottom, select 'Excel Add-ins', click 'Go', check the 'Analysis ToolPak', and click 'OK'.
What is the significance of the alpha level in a one-way ANOVA test?
-The alpha level is the significance threshold used in hypothesis testing. It is commonly set at 0.05, meaning that if the p-value is less than or equal to 0.05, the null hypothesis is rejected in favor of the alternative hypothesis.
How is the degrees of freedom calculated for the 'between groups' and 'within groups' in ANOVA?
-The degrees of freedom for 'between groups' is calculated by subtracting one from the number of groups. For 'within groups', it is calculated by subtracting the number of groups from the total number of observations.
What does the 'SS' in ANOVA represent and how is it used?
-'SS' stands for the sum of squares, which quantifies the variability either between the groups or within the groups. It is used to calculate the mean square (MS) by dividing SS by the degrees of freedom.
What is the F-statistic in ANOVA and how is it calculated?
-The F-statistic is the test statistic used in the one-way ANOVA test. It is calculated as the ratio of the mean square between the groups to the mean square within the groups.
What does a p-value represent in the context of a hypothesis test?
-The p-value represents the probability of observing the test results under the assumption that the null hypothesis is true. A smaller p-value indicates stronger evidence against the null hypothesis.
What is the conclusion if the p-value is greater than the alpha level in a one-way ANOVA test?
-If the p-value is greater than the alpha level, the null hypothesis is not rejected, indicating that there is not enough evidence to conclude that there is a significant difference between the group means.
What is a post hoc test and why is it performed after a significant ANOVA result?
-A post hoc test is performed to determine which specific groups differ from each other after a significant ANOVA result. The one-way ANOVA test only indicates that there is a difference among the groups, not where the differences lie.
Outlines
📊 Introduction to One-Way ANOVA in Excel
This paragraph introduces the video tutorial's purpose, which is to demonstrate how to conduct a one-way analysis of variance (ANOVA) using Microsoft Excel. The presenter explains the process of performing the test and analyzing the results. They encourage viewers to like the video for support and to leave comments with any questions. The data set consists of three groups' performance on a vertical jump test, with 15 participants in each group, measured in centimeters. The presenter outlines the steps to perform the one-way ANOVA, starting with installing the Analysis Toolpak add-on in Excel and proceeding to select the input range and grouping method. They also explain the significance of the alpha level and how to choose output options for the test results.
📈 Interpreting One-Way ANOVA Results in Excel
This paragraph delves into the interpretation of the one-way ANOVA results generated by Excel. It begins with a summary table explaining the count, sum, average, and variance for each group. The presenter then discusses the ANOVA results table, which includes the sum of squares (SS), degrees of freedom (df), mean square (MS), and the F-statistic. The F-statistic is calculated as the ratio of the mean square between groups to the mean square within groups. The critical F value and p-value are also explained, with the p-value indicating the probability of observing the results under the null hypothesis. The presenter uses an example with an alpha level of 0.05 to illustrate the decision-making process for rejecting or accepting the null hypothesis. They conclude by noting that if the results are significant, further investigation with post hoc tests is necessary to determine which specific groups differ. The video ends with an invitation for viewers to like, comment, and subscribe for more tutorials.
Mindmap
Keywords
💡One-Way ANOVA
💡Microsoft Excel
💡Analysis Toolpak
💡Significance Threshold
💡Degrees of Freedom (df)
💡Sum of Squares (SS)
💡Mean Square (MS)
💡F-Statistic
💡P-Value
💡Post Hoc Test
Highlights
The tutorial demonstrates how to perform a one-way ANOVA using Microsoft Excel.
The importance of installing or activating the Analysis Toolpak for statistical analyses in Excel is emphasized.
The tutorial uses example data from three different mail groups' performance on a vertical jump test.
Data from 15 participants in each group is used, with each cell representing a participant's jump height in centimeters.
Instructions on how to install the Analysis Toolpak are provided, including navigating through Excel options.
The process of selecting the input range for the one-way ANOVA test in Excel is explained.
The significance of choosing the correct grouping method (by columns or rows) for data analysis is discussed.
The alpha level, set at 0.05, determines the significance threshold for the test results.
Different output options for the ANOVA results in Excel are presented, including a new worksheet or a separate file.
The results of the one-way ANOVA test are interpreted, including the summary table and ANOVA results table.
The meaning of count, sum, average, and variance in the summary table is explained.
The concept of sum of squares (SS), degrees of freedom (df), and mean square (MS) is introduced.
The F-statistic and its role in determining the significance of the test results are discussed.
The tutorial explains how to compare the F-statistic with the F critical value to assess significance.
The p-value's role in hypothesis testing and its comparison with the alpha level is clarified.
The conclusion that there is no significant difference between the means of the three groups is reached based on the p-value.
The tutorial mentions the need for post hoc tests to determine specific group differences if the ANOVA is significant.
The video concludes with a reminder to like, comment, and subscribe for more tutorials.
Transcripts
Browse More Related Video
Performing a One-way ANOVA in Excel with post-hoc t-tests
One-Way ANOVA with LSD (Least Significant Difference) Post Hoc Test in Excel

Excel - One-Way ANOVA Analysis Toolpack
Tukey-Kramer Post Hoc Test after One-Way ANOVA in Excel

Statistics 101: ANOVA Post Hoc in Excel (Fisher's LSD)
One-way ANOVA & Post-Hoc Analysis in Excel
5.0 / 5 (0 votes)
Thanks for rating: