Charts Are Like Pasta - Data Visualization Part 1: Crash Course Statistics #5
TLDRThis video discusses different methods of visually representing data to complement numerical summaries. It covers bar charts, pie charts, pictographs, and histograms as ways to depict categorical and quantitative data, analyzing their appropriate uses and potential pitfalls. Concepts like frequency tables, binning, and misleading representations are explained to promote skill as both producers and critical consumers of data visualizations in news and social media.
Takeaways
- 😀 There are two main types of data: categorical (no meaningful order) and quantitative (has order and consistent spacing)
- 😊 Frequency and relative frequency tables summarize categorical data
- 📊 Visualizations like bar charts, pie charts and pictographs display categorical data
- 😮 Quantitative data can be binned into categories to create frequency tables
- 😡 Uneven binning can obscure or misrepresent data
- 📈 Histograms display quantitative data and show distribution shape
- 😀 Visualizations provide another way to comprehend numbers beyond raw data
- 👀 Always scrutinize visualizations - they may hide or obscure information
- 😊 Simple visualizations like bar and pie charts effectively show one variable
- 😕 More complex data needs more complex visualizations to fully capture
Q & A
What are the two main types of data discussed in the video?
-The two main types of data discussed are categorical data and quantitative data.
How can we visually represent categorical data?
-We can visually represent categorical data using frequency tables, bar charts, pie charts, and pictographs.
What is binning and how is it used with quantitative data?
-Binning is the process of dividing quantitative data into categories or 'bins'. It allows us to analyze quantitative data similarly to categorical data using frequency tables.
What makes a histogram different from a regular bar chart?
-In a histogram, the bars representing quantitative data are squished together because the data is continuous. In a regular bar chart, there are spaces between the bars.
How can unequally spaced bins be misleading?
-Unequally spaced bins can obscure certain trends or groups in the data by selectively distributing data points. They should generally only be used if there is a real world distinction between the bins.
What are some ways you can identify the distribution of data from a histogram?
-From a histogram you can estimate the mean, median, mode, skewness and spread of the distribution based on the location and shape of the bars.
What are the benefits of a bar chart over a frequency table?
-A bar chart allows you to visually compare frequencies, while a frequency table only provides the raw numbers.
When should you use a pie chart versus a bar chart?
-Pie charts are good for displaying a single categorical variable, while bar charts are better for comparing multiple categorical variables.
What should you watch out for with pictographs?
-With pictographs, make sure the picture sizes or quantities are accurately proportional to the frequencies. Otherwise they can be misleading.
Why is it important to understand different data visualizations?
-Understanding data visualizations allows you to better interpret the information being presented to you in things like news articles and reports.
Outlines
📊 The Importance of Data Visualization
Adriene Hill introduces the concept of data visualization, emphasizing its significance in everyday life, from news to social media. She explains the difference between categorical and quantitative data, with examples like types of pasta and olive oil quantities, illustrating how these data types are organized and visualized. The video script elaborates on various methods for displaying data, such as frequency tables, relative frequency tables, and visual representations like bar charts, pie charts, and pictographs. Adriene highlights the use of these tools in making data comparisons more accessible and understandable, underscoring the value of visual data representation in enhancing our comprehension of information.
📉 Understanding and Misinterpreting Data Visualizations
This segment transitions to a mock 'breaking news' format to discuss the graduation rate's improvement, using this as a springboard to highlight common pitfalls in data visualization, such as misleading scales and proportions in pictographs. Adriene returns to the topic of quantitative data, explaining the process of 'binning' to categorize data for better visualization and analysis. She illustrates how data can be manipulated, for example, through 're-binning' to obscure unfavorable statistics, using a hypothetical politician's scenario. The discussion extends to histograms as a method for visualizing quantitative data, emphasizing the need for critical analysis of visual representations to understand what they reveal or conceal. Adriene concludes by stressing the importance of being a discerning consumer of data visualizations, recognizing both their utility and potential for misrepresentation.
Mindmap
Keywords
💡data visualization
💡quantitative data
💡categorical data
💡frequency table
💡bar chart
💡pie chart
💡pictograph
💡binning
💡histogram
💡axis
Highlights
Researchers developed a new vaccination technology that uses RNA and nanoparticles to stimulate T cells and B cells to generate immunity against cancers or pathogens.
The RNA vaccination approach produced strong immune responses and protected animal models from melanoma and influenza virus.
This nanoparticle delivery system allows rapid engineering of RNA vaccines, enabling a faster response to emerging viral diseases compared to traditional vaccine development.
The researchers observed no adverse effects from the administration of their RNA vaccine platform in animal models.
The modular design of this vaccination approach allows for easy switching of the antigen component to target different cancers or pathogens.
This technology has the potential to enable rapid development of personalized cancer vaccines using tumor neoantigens specific to each patient.
The nanoparticles protect the RNA from degradation and facilitate delivery to immune cells, leading to efficient antigen expression and immune activation.
Further optimization of nanoparticle composition, antigen selection, and RNA design could continue to improve the potency and specificity of responses elicited by this vaccine platform.
The researchers propose this RNA vaccination strategy as a versatile platform that may complement or enhance conventional vaccine approaches against pathogens.
This study provides proof-of-concept for an innovative vaccination approach using RNA and nanoparticles that could accelerate vaccine development and impact a range of human diseases.
The modular, rapid-engineering capabilities of this vaccine platform distinguish it from traditional vaccine strategies and could enable timely response to future pandemic threats.
The researchers are continuing to optimize and evaluate this RNA vaccination system in additional animal models to support clinical advancement of this technology.
Overall, this work establishes a promising RNA vaccination strategy that leverages nanotechnology to stimulate robust immune responses against cancer and infectious disease.
This versatile and adaptable vaccination approach has potential for broad impact and further development as a platform technology to address unmet medical needs.
The researchers propose that this RNA vaccine platform could be rapidly tailored to provide immunization against virtually any antigen of interest.
Transcripts
Browse More Related Video
Descriptive statistics and data visualisation. An introduction to statistics and working with data
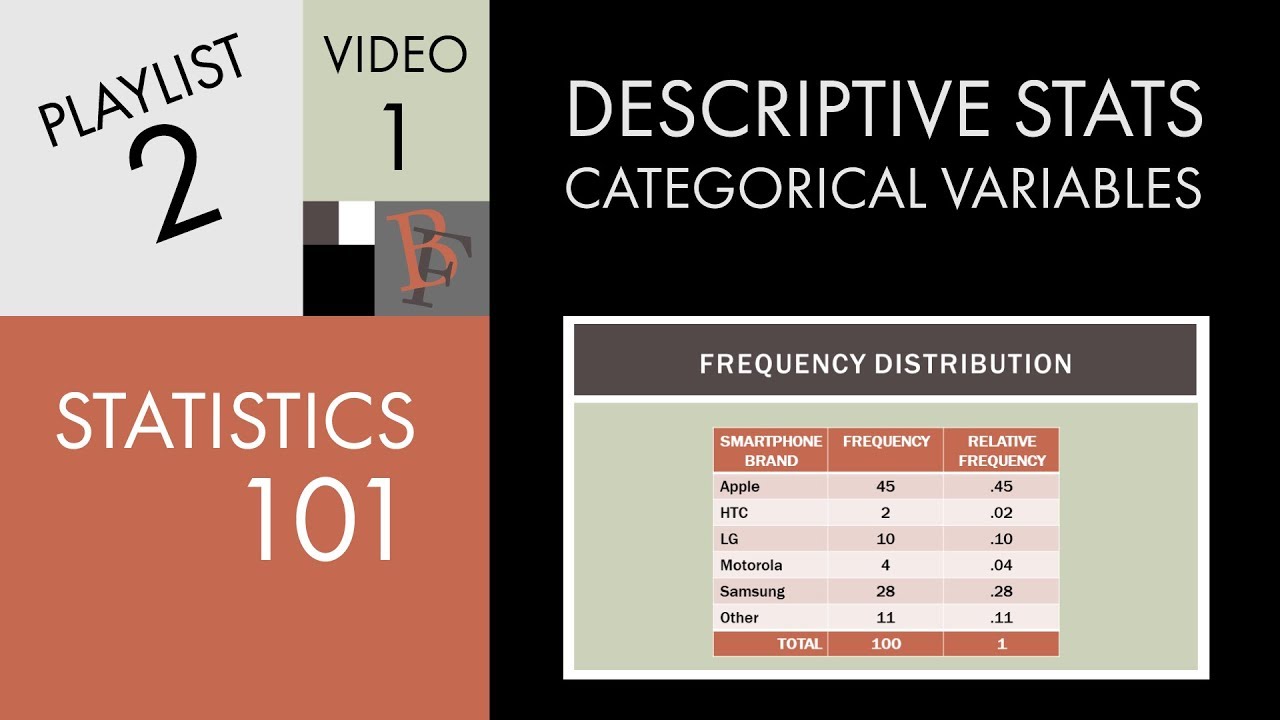
Statistics 101: Describing a Categorical Variable

Bar Chart, Pie Chart, Frequency Tables | Statistics Tutorial | MarinStatsLectures

Elementary Stats Lesson 2
Discrete v/s Continuous Data - What ? How ? || Discrete Data || Continuous Data || Basic Statistics

Descriptive Statistics [Simply explained]
5.0 / 5 (0 votes)
Thanks for rating: