The Normal Distribution: Crash Course Statistics #19
TLDRIn this episode of Crash Course Statistics, Adriene Hill delves into the significance of the normal distribution, a cornerstone concept in statistics that impacts the analysis of data in various fields. Despite the varied distribution of individual measurements like height, IQ, and the weight of cereal boxes, which can be normally distributed, and others like blood pressure, which aren't, the episode highlights the normal distribution's role in understanding sample means. Through the lens of the Central Limit Theorem, Hill illustrates how, regardless of the population's initial distribution, the distribution of sample means tends towards normality as sample sizes increase. This principle underpins many inferential statistical methods, enabling meaningful comparisons between groups and facilitating the use of the normal distribution to calculate probabilities and assess statistical significance.
Takeaways
- 📚 The normal distribution is crucial in statistics for understanding phenomena like height, IQ, and standardized test scores, which tend to cluster around a central value.
- 🤔 Many real-world phenomena do not follow a normal distribution, including blood pressure, debt, and fuel efficiency, showcasing the diversity of distribution patterns.
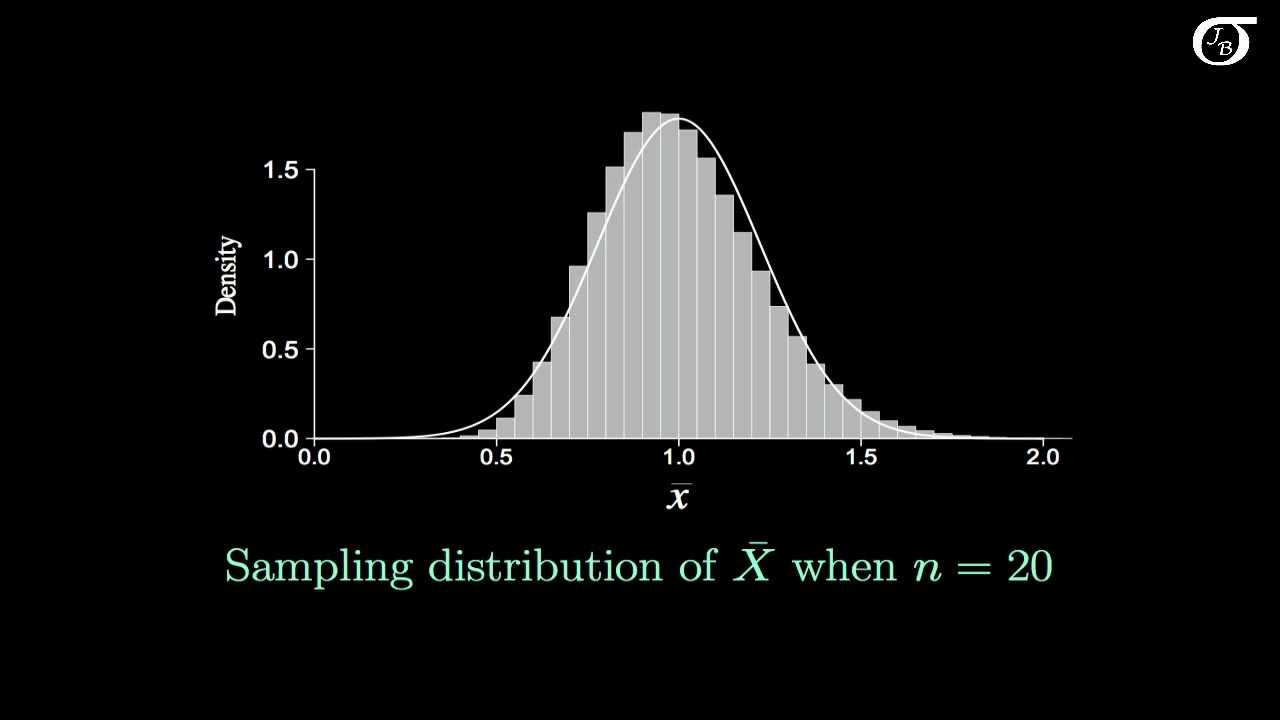
- 📈 The distribution of means is normally distributed even if the original population isn't, thanks to the Central Limit Theorem, simplifying statistical analysis.
- 🔬 The normal distribution's symmetry means its mean, median, and mode coincide, focusing most common values in the middle with fewer extremes.
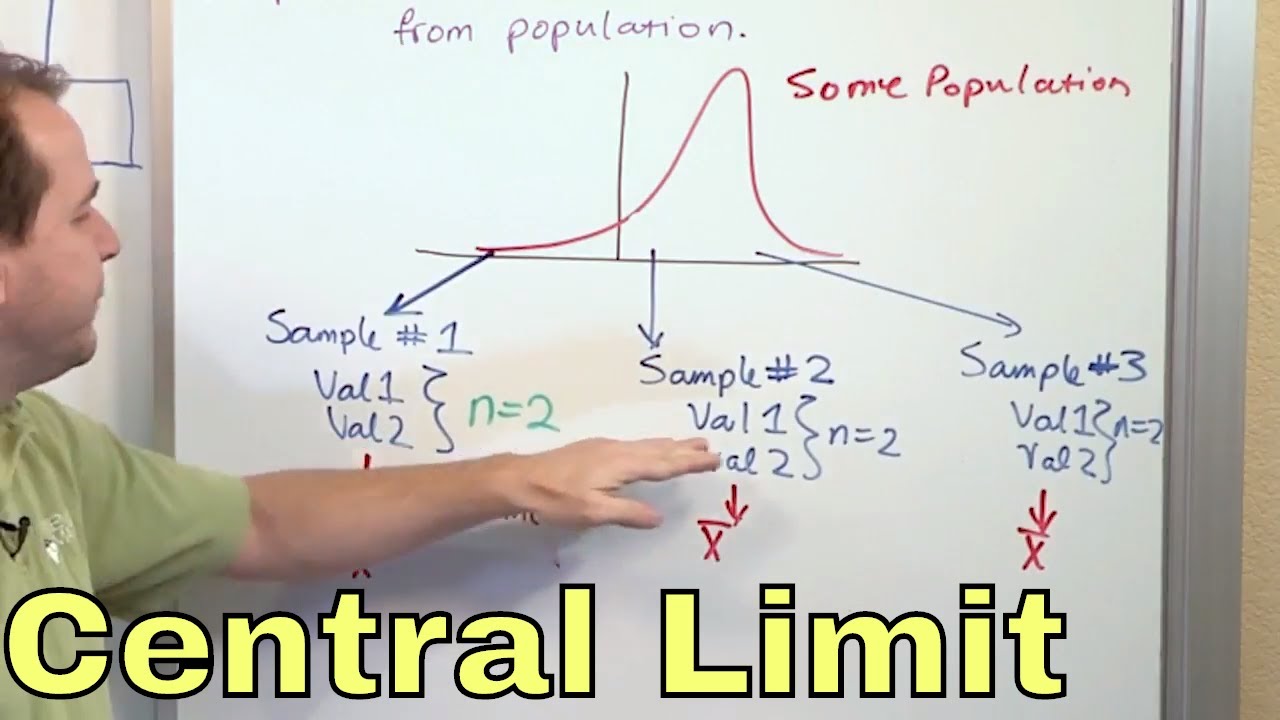
- 👨💻 Scientific questions often compare groups (samples) rather than individual observations, making the distribution of sample means more relevant than individual data points.
- 🚡 Sampling distribution of sample means, or the sampling distribution, describes the process of sampling rather than an actual plotted distribution.
- 🎲 Demonstrations with dice rolls illustrate how even non-normal population distributions lead to normally distributed sample means as sample size increases.
- 📊 The Central Limit Theorem underpins many inferential statistical techniques by ensuring the normality of sample means distributions for large enough samples.
- 📉 The standard deviation of the sampling distribution, or standard error, decreases as sample size increases, sharpening the distribution.
- 📱 Simulations and real-world examples, like weighing strawberry boxes, illustrate how statistical tools can assess the likelihood of observed outcomes based on the normal distribution.
Q & A
Why do we often look at the distribution of sample means instead of population distributions?
-Because scientific questions usually compare groups or samples rather than individuals. The distribution of sample means tends to be normal even if the original population distribution is not.
What is the Central Limit Theorem?
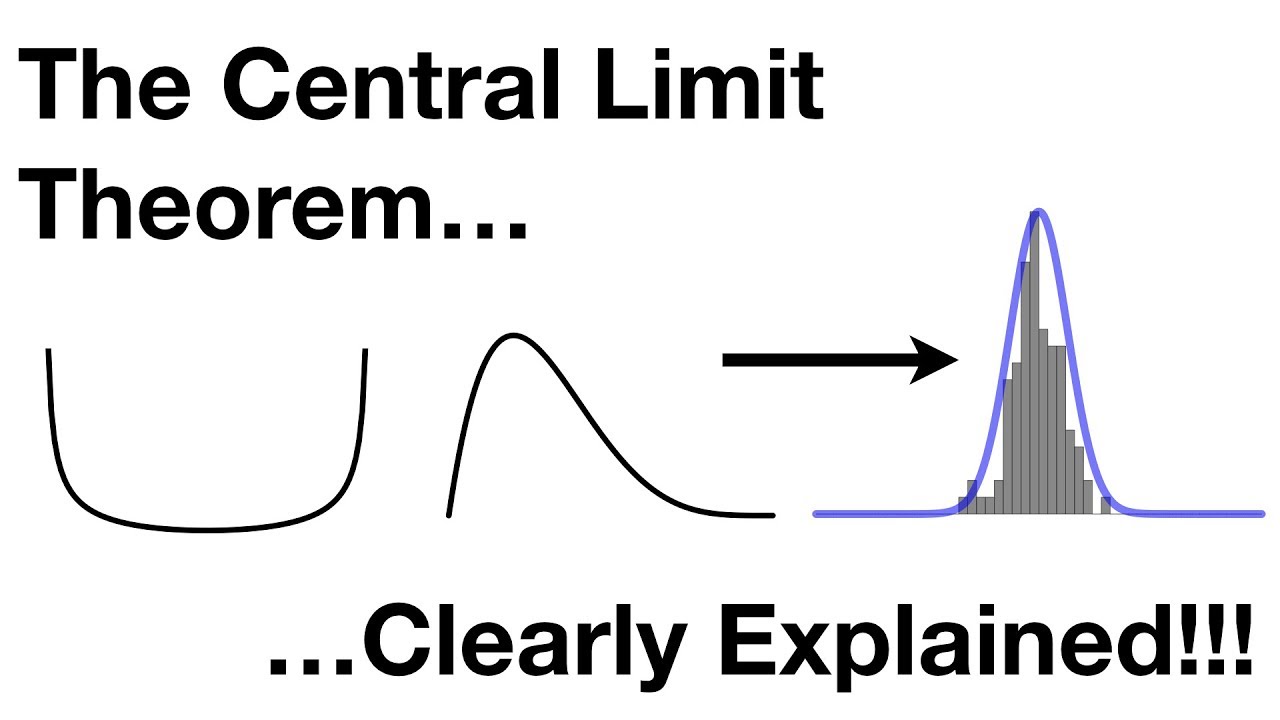
-The Central Limit Theorem states that the distribution of sample means for an independent, random variable will get closer and closer to a normal distribution as the sample size increases, even if the original population distribution isn't normal.
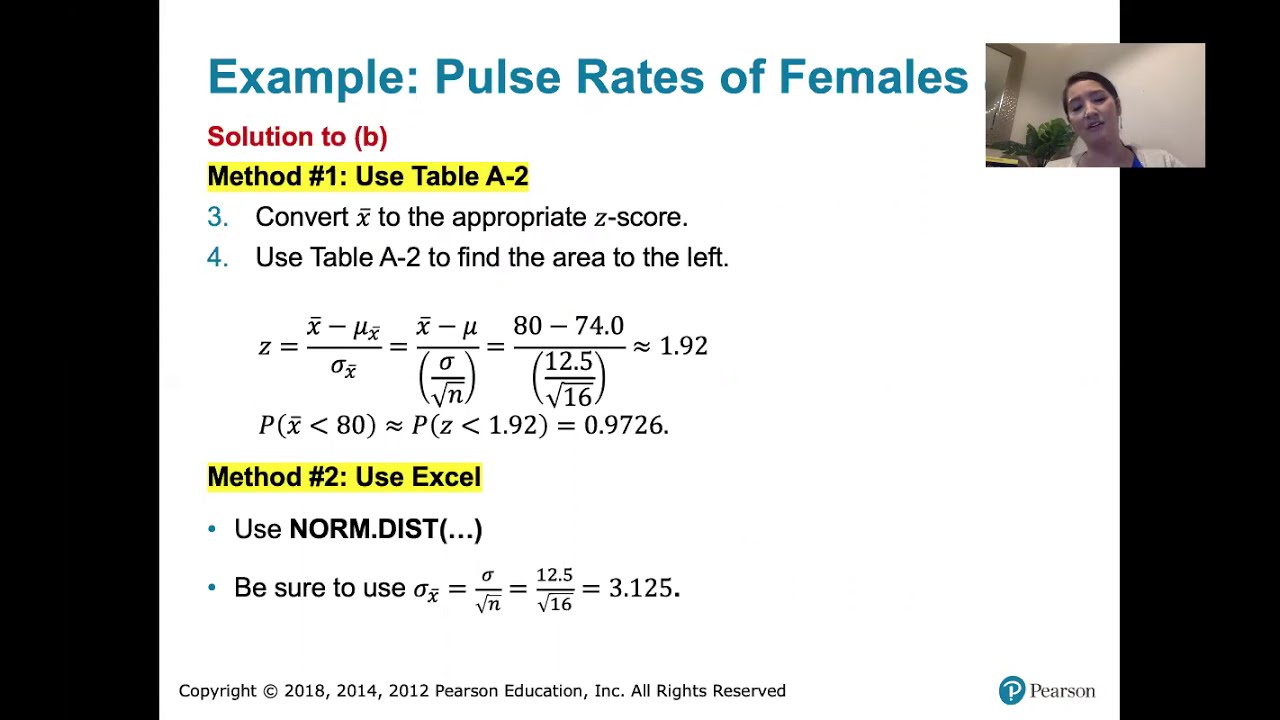
How does the standard error relate to the population standard deviation?
-The standard error is the standard deviation of the distribution of sample means. It is calculated by dividing the population standard deviation by the square root of the sample size.
What happens to the standard error as sample size increases?
-As the sample size increases, the standard error gets smaller. This reflects that the sample means get closer to the true population mean with larger sample sizes.
What is the mean of the sampling distribution equal to?
-The mean of the sampling distribution is always equal to the mean of the original population distribution.
How can the central limit theorem be useful?
-The central limit theorem allows us to assume sampling distributions are normal. This means we can use the same statistical tools like z-scores, confidence intervals, etc for different types of populations and research questions.
What happens to extreme values in the distribution as sample size increases?
-As sample size increases, extreme values become less and less likely. This causes the distribution to look more normal, with more weight in the middle.
What does the distribution of sample means allow us to calculate?
-The distribution of sample means allows us to calculate things like percentiles and determine how unusual a difference between two sample means is.
What is an example application of sampling distributions?
-We can use sampling distributions to evaluate whether a grocery store changed suppliers based on weighing some sample boxes. We compare the sample mean weight to what we expect from the distribution.
What makes normal distributions useful for statistical comparisons?
-Normal distributions are symmetric and simple to describe mathematically based only on the mean and standard deviation. This makes comparisons using things like z-scores straightforward.
Outlines
📚 The Importance of the Normal Distribution
Adriene Hill introduces the concept of the normal distribution, a foundational element in statistics particularly relevant to understanding a wide range of phenomena, from human attributes like height and IQ, to mechanical outputs like the weight of cereal boxes. Despite many real-world distributions not being normal (e.g., blood pressure, debt, fuel efficiency), the episode explains the significance of the normal distribution in the context of statistical analysis. The central theme revolves around the fact that while individual data points may vary widely, the distribution of sample means tends toward a normal distribution due to the Central Limit Theorem (CLT). This theorem asserts that as sample size increases, the sampling distribution of the mean will approximate a normal distribution, regardless of the population's original distribution. This principle underlies many inferential statistics techniques, making the normal distribution a critical concept for comparing groups and understanding scientific questions.
🎲 Simulating the Central Limit Theorem
This paragraph delves into the application of the Central Limit Theorem (CLT) through various examples and simulations. It begins with a simple illustration using dice rolls to explain how the distribution of sample means becomes increasingly normal as sample size increases, even for distributions that are not initially normal. The narrative illustrates how, regardless of the original distribution's shape, the sampling distribution of the mean for large samples is approximately normal, enabling the use of the normal distribution's properties for statistical analysis. The discussion includes how sampling distributions allow for the calculation of percentiles and the assessment of differences between two sample means. It also touches on the concept of standard error, which adjusts the population standard deviation for sample size, illustrating its role in evaluating the significance of differences between sample means. Through examples involving dice rolls and the mean weight of strawberry boxes, the paragraph conveys the practical implications of the CLT for making inferences about populations based on sample data.
🌎 Broad Applications of the Central Limit Theorem
The final segment emphasizes the wide-ranging applications of the Central Limit Theorem (CLT) in making meaningful comparisons across diverse fields and questions. By illustrating how the CLT facilitates comparisons at the group level rather than the individual level, the paragraph underscores the convergence of various population distributions to the normal distribution. This simplification allows for straightforward analyses and comparisons between groups on issues as varied as employment practices and health outcomes. The segment concludes the episode on a note of inclusivity, highlighting the CLT's role in enabling a unified approach to answering a broad spectrum of scientific and social questions, thereby underscoring the fundamental importance of the normal distribution in statistical analysis and decision-making.
Mindmap
Keywords
💡normal distribution
💡Central Limit Theorem
💡sampling distribution
💡standard error
💡sample size
💡population distribution
💡sample mean
💡variance
💡probability
💡statistical inference
Highlights
The speaker discusses using machine learning models to predict student performance and identify at-risk students.
They propose a new method for feature selection that improved model accuracy by 5-10% over baseline methods.
Their experiments show the model can predict high school dropout rates with 80% accuracy using only data from 8th grade.
They argue these types of models could allow schools to provide early intervention and support to students at risk of dropping out.
The speaker highlights ethical concerns with using student data to power predictive models.
They discuss the importance of transparency and avoiding bias when building these types of ML systems.
They propose new techniques to explain model predictions to stakeholders like teachers, parents, and policymakers.
They argue ML models should be used to support human decision-making rather than replace it entirely in the education system.
During Q&A, the speaker highlights the need for interpretable models over maximizing accuracy alone.
In response to an audience question, they emphasize the importance of testing for fairness across different demographic groups.
The speaker concludes by calling for collaboration between ML researchers, educators, and policymakers to develop ethical, transparent systems.
They argue advances in ML provide an opportunity to transform education and support students more effectively.
However, we must ensure these systems are designed and governed responsibly to avoid potential downsides.
The speaker calls for developing guidelines and best practices for fair, interpretable, and ethical use of ML in education.
They encourage the ML community to engage closely with stakeholders like students, parents, and teachers when building these systems.
Transcripts
Browse More Related Video
The Central Limit Theorem, Clearly Explained!!!

Central limit theorem | Inferential statistics | Probability and Statistics | Khan Academy
Introduction to the Central Limit Theorem
02 - What is the Central Limit Theorem in Statistics? - Part 1

Sampling distribution of the sample mean | Probability and Statistics | Khan Academy
6.4.2 The Central Limit Theorem - Probabilities for a Range of Normally Distributed Sample Means
5.0 / 5 (0 votes)
Thanks for rating: