Graphing Lines in Slope-Intercept Form (y = mx + b)
TLDRThe script explains how to derive the equation for a line given two points or one point and the slope. It starts by reviewing key concepts - the coordinate plane, variables X and Y, slope M, and Y-intercept B in the equation Y=MX+B. It then walks through examples finding the equation from two points and from one point plus slope. Finally, it discusses graphing lines by marking two points and connecting them, emphasizing lines extend infinitely. It notes equations allow calculating points to plot lines. The goal is developing competency with core linear equation concepts and applications.
Takeaways
- 📊 The coordinate plane is used for graphically representing equations.
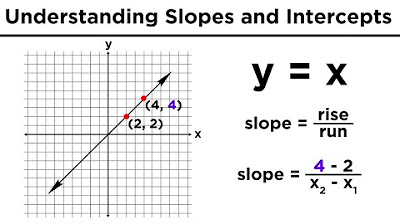
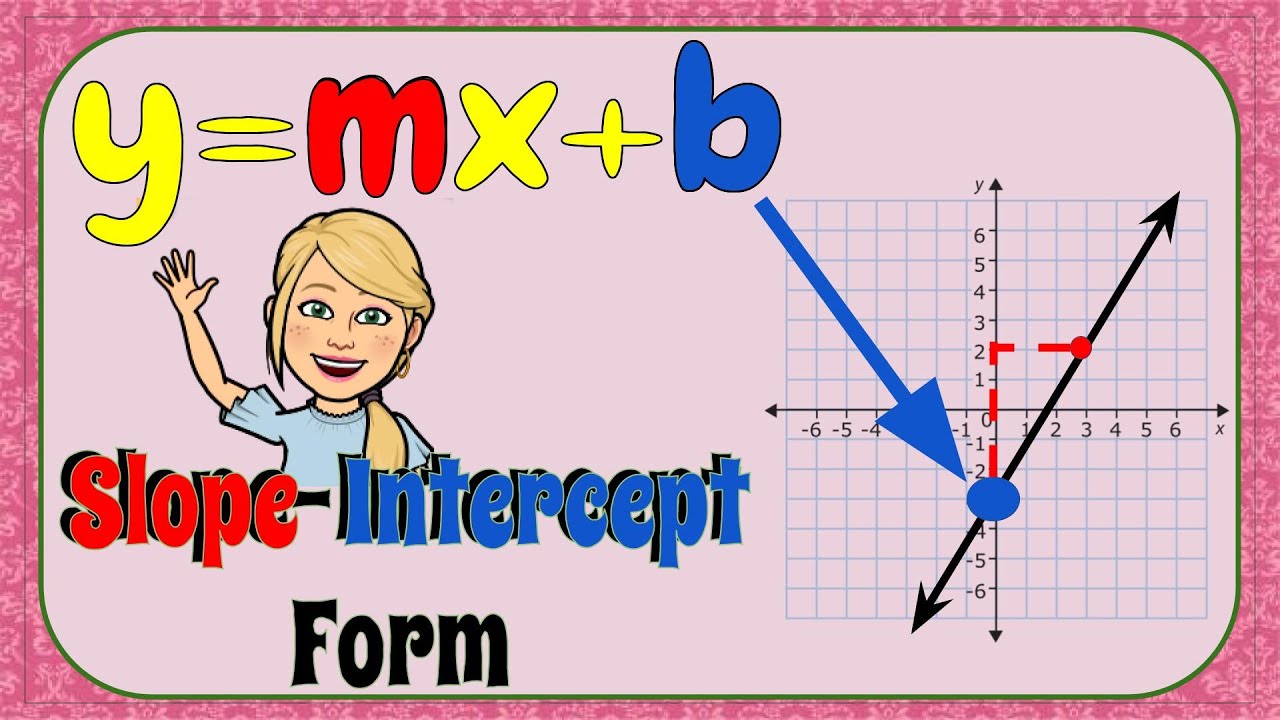
- 📈 The standard form of a line's equation is Y = MX + B, where M is the slope and B is the Y-intercept.
- 🔍 To find the equation of a line, you can use two points that the line passes through.
- 🧮 The slope (M) of a line is calculated as 'rise over run', or the change in Y over the change in X.
- 📐 After calculating the slope, it's plugged into the equation Y = MX + B to find B, the Y-intercept.
- 🔢 To find B, plug the X and Y coordinates of any point on the line into the equation and solve for B.
- ✅ Verifying the equation: You can use a second point on the line to ensure the calculated B is correct.
- 📝 If given one point and the slope, the equation of the line is simpler to find as only B needs to be solved.
- 🖊️ Graphing a line involves marking at least two points on the line and drawing a line through them.
- 🔄 Linear equations can be graphed by choosing any values for X, finding corresponding Y values, and plotting these points.
Q & A
What does the equation Y = MX + B represent?
-The equation represents a linear equation where Y and X are variables, M is the slope of the line, and B is the Y-intercept, the Y value where the line crosses the Y axis.
How can you find the equation of a line?
-You can find the equation of a line by using any two points that lie on the line to calculate the slope (M) and then solving for the Y-intercept (B) using one of the points.
How do you calculate the slope of a line?
-The slope of a line is calculated as the rise over run, which is the change in Y values divided by the change in X values between two points on the line.
What steps are involved in finding the Y-intercept (B) of a line?
-To find the Y-intercept (B), plug in the X and Y values of a point on the line into the equation Y = MX + B, and solve for B.
What does it mean when a line is said to extend infinitely in either direction?
-It means that the line continues without end in both directions, represented graphically by arrows on either end of the line segment.
How do you graph a line once you have the equation?
-To graph a line, mark two points on the line, then carefully draw the line passing through these points, extending infinitely in either direction.
What are different ways to choose points for graphing a line?
-Points for graphing a line can be chosen from given points, an intercept and another point determined by applying the slope, or by plugging any X values into the equation to get Y values.
How can the slope and a single point be used to write the equation of a line?
-If you are given one point and the slope, you can plug these into the equation form Y = MX + B and solve for B to write the entire equation of the line.
What is the importance of the Y-intercept in the equation of a line?
-The Y-intercept is crucial because it provides the exact point where the line crosses the Y-axis, helping to accurately position the line on a graph.
How can verifying the equation with a second point ensure accuracy?
-Verifying the equation with a second point ensures accuracy by confirming that the equation correctly represents the line passing through both points, validating the calculation of the slope and Y-intercept.
Outlines
📊 Graphing Lines and Understanding Linear Equations
Professor Dave introduces the concept of graphing lines on the coordinate plane and explains the process of finding the equation of a line given some data points. The focus is on plotting lines graphically using the equation form Y = MX + B, where M represents the slope and B is the Y-intercept. By using examples, such as points (-2, 3) and (1, 5), the video script demonstrates how to calculate the slope ('rise over run') and determine the Y-intercept (B) by plugging in coordinates of any point on the line. This methodical approach allows for the derivation of the linear equation Y = 2/3X + 13/3 for the given points. Additionally, the script covers how to graph lines by marking two points and drawing the line through them, emphasizing that any two points are sufficient to graph the line representing the linear equation. This foundational knowledge enables learners to understand how to find the equation of a line given two points or one point and the slope, further simplifying the process of graphing linear equations.
Mindmap
Keywords
💡Coordinate Plane
💡Equation of a Line
💡Slope
💡Y-Intercept
💡Graphical Representation
💡Rise over Run
💡Two Points
💡Ordered Pair
💡Linear Equation
💡Graphing Lines
Highlights
Introduction to graphing lines on the coordinate plane.
Explaining the graphical representation of equations.
Finding the equation of a line with given data.
Introduction to the linear equation form Y = MX + B.
Defining variables X, Y, slope (M), and Y-intercept (B).
Using two points to define and find the equation of a line.
Example given with points (negative two, three) and (one, five).
Calculating slope as rise over run.
Deriving the linear equation using the slope and a point.
Solving for B using the coordinates of a point on the line.
Verification of B using another point on the line.
Final equation of the line Y = 2/3X + 13/3.
Simplifying the process when given one point and the slope.
Graphing lines by marking two points and drawing the line through them.
Explanation of infinite extension of lines denoted by arrows.
Transcripts
Browse More Related Video


5.0 / 5 (0 votes)
Thanks for rating: