4 Steps to Graphing Slope-Intercept Form | 8.EE.B.6 💗
TLDRThis video lesson from 'The Magic of Math' series delves into the slope-intercept form of linear equations. It aims to help viewers understand how to identify the slope (m) and y-intercept (b) from a linear equation written as y = mx + b. The video emphasizes the importance of recognizing that the y-intercept is where the line crosses the y-axis (an ordered pair with an x-coordinate of 0) and explains how to use these elements to graph a line. The process is demonstrated through examples, encouraging viewers to practice graphing lines by identifying the slope and y-intercept and applying these to visually represent the equation on a graph.
Takeaways
- 📚 The lesson focuses on understanding and using the slope-intercept form (y = mx + b) for linear equations.
- 🔍 Identifying the slope (m) and y-intercept (b) is crucial for graphing linear equations.
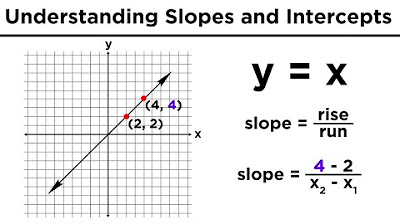
- 📈 The slope represents the rate of change (rise over run) between points on the line.
- 📍 The y-intercept is the point where the line crosses the y-axis, with an x-coordinate of 0.
- 🤔 The y-intercept is a constant that indicates the y-coordinate of the line's intersection with the y-axis.
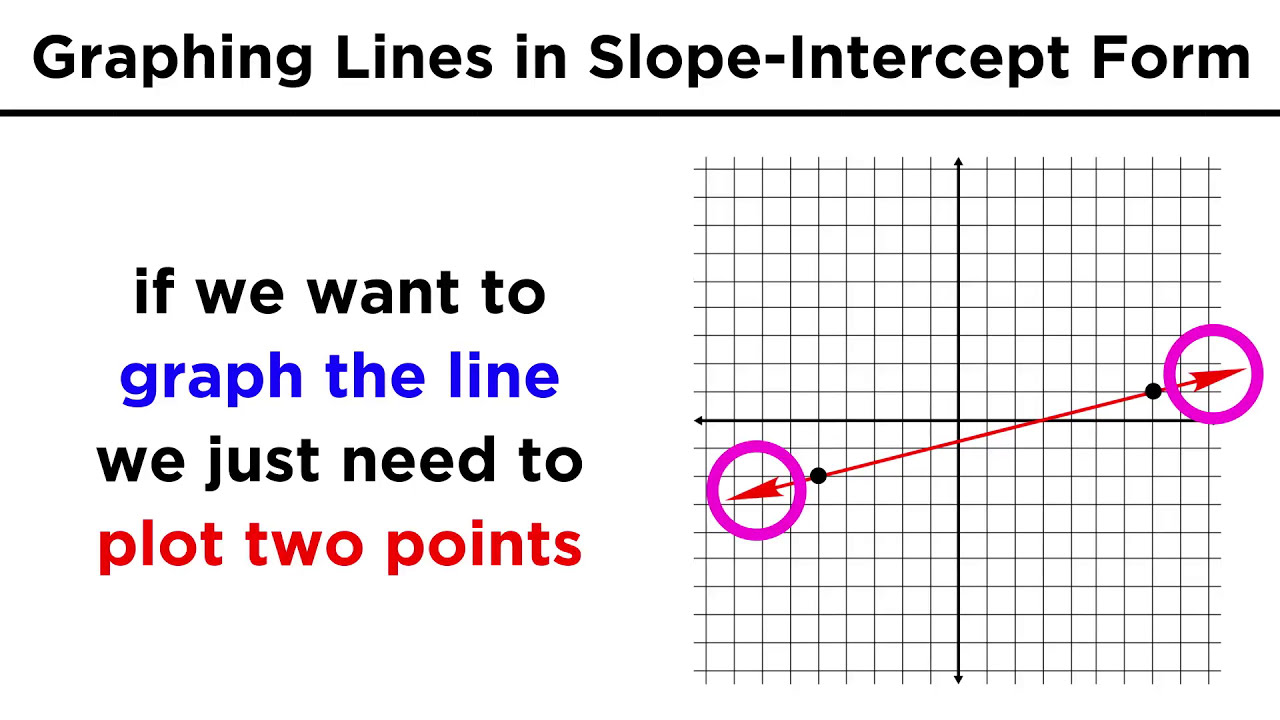
- 📊 To graph a line, first plot the y-intercept, then use the slope to find additional points.
- 🖋️ When the slope is positive, the line rises from left to right; when negative, it falls from left to right.
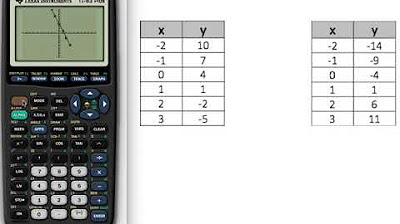
- 🌟 Every x and y ordered pair on the line is a solution to the linear equation.
- 🛠️ The process of graphing involves identifying the slope and y-intercept, plotting points, and connecting them to form the line.
- 🎓 The video encourages practice by pausing and allowing viewers to attempt graphing before revealing the solutions.
- 🎥 The Magic of Math series aims to master math concepts one video at a time, focusing on linear equations in this particular lesson.
Q & A
What is the slope-intercept form of a linear equation?
-The slope-intercept form of a linear equation is written as y = mx + b, where m represents the slope of the line and b represents the y-intercept.
What does the variable m in the slope-intercept form represent?
-In the slope-intercept form, the variable m represents the slope of the line, which is the ratio of the vertical change (rise) to the horizontal change (run) between any two points on the line.
What is the significance of the y-intercept in the context of a linear equation?
-The y-intercept, represented by the variable b in the slope-intercept form, is the y-coordinate of the point where the line crosses the y-axis. It is always an ordered pair of (0, b) since it lies on the y-axis where the x-coordinate is zero.
How do you identify the slope and y-intercept from a given linear equation?
-To identify the slope (m) and y-intercept (b) from a linear equation, first ensure the equation is in slope-intercept form (y = mx + b). The coefficient of x is the slope, and the constant term following the x (including its sign) represents the y-intercept.
What is the process for graphing a line using the slope-intercept form?
-To graph a line using the slope-intercept form, first identify the slope (m) and y-intercept (b). Then, plot the y-intercept on the graph (x-coordinate is 0). Use the slope to 'rise' the change in y and 'run' the change in x to find another point on the line. Finally, connect the points with a straight line to complete the graph.
What happens when the slope of a line is negative?
-When the slope of a line is negative, the line falls from left to right. This means the line crosses the y-axis at a positive y-intercept and decreases in value as it moves to the right on the x-axis.
How does the slope of a line affect the direction in which the line goes on a graph?
-The slope of a line determines the direction of the line on a graph. A positive slope means the line goes upwards from left to right, while a negative slope indicates the line goes downwards from left to right.
What is the relationship between the ordered pairs (x, y) on a line?
-The ordered pairs (x, y) on a line represent specific inputs (x-values) that map to specific outputs (y-values). These pairs are solutions to the linear equation and represent points on the line, with each pair corresponding to a unique solution.
How can you calculate the slope using two ordered pairs?
-To calculate the slope using two ordered pairs (x1, y1) and (x2, y2), you subtract the y-coordinates (rise) and divide by the x-coordinates (run), resulting in the ratio (y2 - y1) / (x2 - x1), which gives you the slope.
What is the role of the y-coordinate in the y-intercept ordered pair?
-In the y-intercept ordered pair (0, b), the y-coordinate (b) represents the point on the y-axis where the line crosses, indicating the value of y when x is zero.
How can you determine if a point is the y-intercept just by looking at its ordered pair?
-A point is the y-intercept if its ordered pair has an x-coordinate of 0. This is because the y-intercept always lies on the y-axis, where the horizontal change (x-coordinate) is zero.
Outlines
📚 Introduction to Slope-Intercept Form
This paragraph introduces the concept of slope-intercept form in linear equations. It sets the objective for viewers to learn how to identify the slope (m) and y-intercept (b) from the graph of a linear equation. The explanation emphasizes the importance of understanding that a line represents an infinite number of points, each an ordered pair (x, y), which are solutions to the linear equation. The video prompts viewers to consider the unique characteristic of the y-intercept in any linear equation and explains that the slope (m) is the ratio of rise over run, while the y-intercept (b) is the point where the line crosses the y-axis.
📈 Identifying and Graphing Linear Equations
This paragraph delves into the process of identifying the slope and y-intercept from a given linear equation and graphing it using these two parameters. The speaker provides a step-by-step guide on how to plot the y-intercept and use the slope to find additional points on the line. It also includes examples of different linear equations, showing how to calculate the slope and y-intercept, and how to plot and connect these points to form the graph of the line. The paragraph concludes with an invitation for viewers to practice graphing lines on their own.
Mindmap
Keywords
💡Slope-Intercept Form
💡Slope
💡Y-Intercept
💡Graphing
💡Ordered Pair
💡Linear Equation
💡Rise Over Run
💡Coordinate Plane
💡Change in Y (Δy) and Change in X (Δx)
💡Point of Intersection
💡Infinite Points
Highlights
The lesson focuses on understanding and identifying the slope and y-intercept of linear equations in slope-intercept form.
The slope-intercept form of a linear equation is expressed as y = mx + b, where m represents the slope and b the y-intercept.
The slope (m) is calculated as the ratio of rise over run, representing the steepness of the line.
The y-intercept (b) is the point where the line crosses the y-axis, with the coordinates (0, b).
Every point on a line is a solution to the linear equation, represented by an ordered pair (x, y).
The slope is the coefficient of x in the equation and reflects the line's steepness.
The y-intercept is the constant term in the equation and indicates the line's intersection with the y-axis.
To graph a line in slope-intercept form, first identify the slope and y-intercept.
Plot the y-intercept on the graph, which has coordinates (0, b).
Use the slope to determine how to move from the y-intercept to find another point on the line.
Connect the points to form the line using a ruler or graphing technology.
The video provides a step-by-step guide to graphing linear equations using the slope-intercept form.
The lesson emphasizes the importance of understanding the relationship between the equation's variables and the line's geometric properties.
The video encourages viewers to practice identifying slopes and y-intercepts to enhance their understanding of linear equations.
The Magic of Math series aims to master math concepts one video at a time, making complex ideas more accessible.
The video concludes with a reminder that the key to understanding slope-intercept form lies in identifying the line's slope and y-intercept.
Transcripts
Browse More Related Video

5.0 / 5 (0 votes)
Thanks for rating: