What is Producer Surplus? | Think Econ | Microeconomic Concepts
TLDRThis video celebrates the channel's milestone of 1000 subscribers and delves into the concept of producer surplus. It builds upon a previous discussion on consumer surplus, using a supply and demand graph to illustrate the equilibrium price and quantity. The host explains that producer surplus is the benefit sellers gain when the selling price exceeds their production costs. The video sets up the foundation for calculating producer surplus algebraically in an upcoming episode, promising to cover real values and algebraic methods for economic analysis.
Takeaways
- 🎉 The channel reached 1000 subscribers, and the team is grateful for the support from viewers.
- 📈 The video discusses the concept of producer surplus, following a previous video on consumer surplus.
- 📊 The equilibrium price and quantity are labeled as p-star and q-star, respectively, on the supply and demand graph.
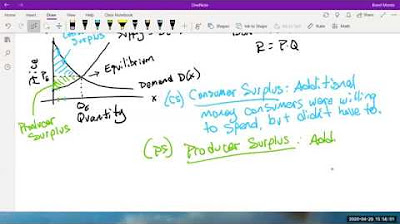
- 💰 Consumer surplus is the area under the demand curve, above the price curve, forming a triangle at the equilibrium.
- 🛒 Producer surplus is the benefit sellers receive when the selling price is more than the minimum price they need to cover their costs.
- 📉 The supply curve represents the lowest price producers are willing to accept to supply a certain quantity, reflecting their costs.
- 🏭 High cost producers need to sell their products at a higher price to recover their costs, which is indicated by the supply curve.
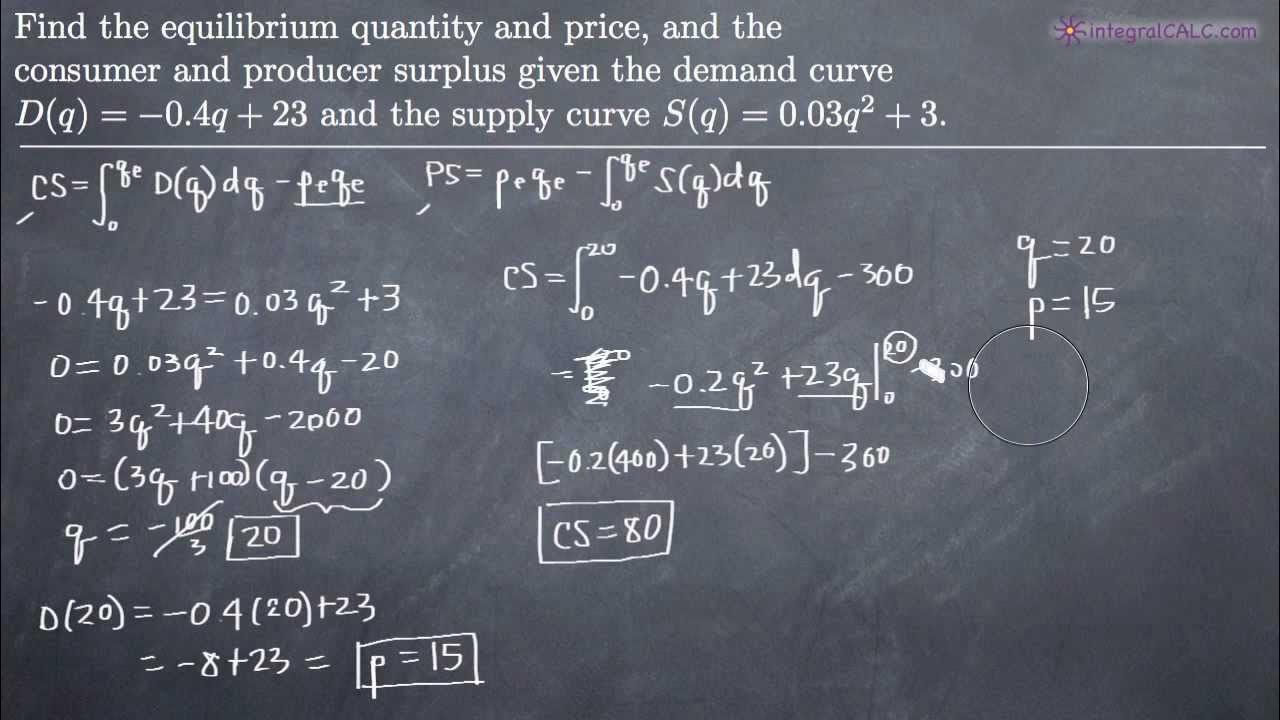
- 🔢 The video will cover the algebraic calculation of producer and consumer surplus in a future episode with real values.
- 📚 The video script provides a conceptual understanding of producer surplus without going into the algebraic details in this episode.
- 🔑 Key values for calculating surplus include p-star, q-star, and the points where supply and demand curves intersect the price axis.
- 👋 The video ends with a call to action for viewers to like, subscribe, and comment with topics or homework questions they'd like covered.
Q & A
What milestone did the channel recently achieve?
-The channel recently hit 1,000 subscribers.
What topic will be covered in the upcoming week?
-The upcoming week will cover the topic of producer surplus.
What is the optimal or equilibrium price referred to in the video?
-The optimal or equilibrium price referred to in the video is labeled as P* (P star).
How is consumer surplus represented on the supply and demand graph?
-Consumer surplus is represented as the triangle below the demand curve and above the price curve.
What does producer surplus represent?
-Producer surplus represents the benefit that sellers receive when the price they receive from consumers is more than the bottom dollar price they need to produce and offer their good for sale.
How does the supply curve relate to producers' costs?
-The supply curve reflects producers' costs as it indicates the lowest price at which producers are willing to supply a specified amount of goods.
What is a producer's reservation price?
-A producer's reservation price is the lowest amount of money they would accept for their product in order to sell it, reflecting their costs.
How is producer surplus represented on the supply and demand graph?
-Producer surplus is represented as the area under the price (P*) and above the supply curve.
What values are needed to calculate consumer and producer surplus?
-To calculate consumer and producer surplus, you need the values of P* (equilibrium price), Q* (equilibrium quantity), and the intersection points of the supply and demand curves with the price axis.
What will be discussed in next week's video?
-Next week's video will discuss how to algebraically calculate producer and consumer surplus with real values without necessarily drawing the graph.
Outlines
🎉 Channel Milestone and Introduction to Producer Surplus
The video begins by celebrating the channel's achievement of reaching 1000 subscribers, expressing gratitude to the audience for their engagement and support. The host then introduces the topic of producer surplus, which follows a previous video on consumer surplus. A brief mention of the latter is made, encouraging viewers to watch it for more context. The video promises to explain producer surplus on a supply and demand graph, without delving into the algebraic details just yet, which will be covered in a future video.
📈 Understanding Producer Surplus Through Supply and Demand
This paragraph delves into the concept of producer surplus, which is defined as the benefit sellers receive when the selling price exceeds their cost of production. The host explains that the supply curve reflects the minimum price producers are willing to accept to supply a good, which is tied to their production costs. The video uses an example of a car manufacturer to illustrate the idea of a 'rock bottom' price. The host also explains that high-cost producers need to sell their products at higher prices to cover their costs. The producer surplus is represented as the area under the price at which goods are sold (p star) and above the supply curve, forming a triangle on the graph. The video concludes with a teaser for the next week's content, which will involve algebraic calculations of consumer and producer surplus using real values.
Mindmap
Keywords
💡Producer Surplus
💡Consumer Surplus
💡Equilibrium Price
💡Equilibrium Quantity
💡Supply and Demand Graph
💡Supply Curve
💡Demand Curve
💡Costs
💡Reservation Price
💡Algebraic Calculation
💡Subscription Milestone
Highlights
Channel reaches 1000 subscribers, expressing gratitude to the audience.
Introduction to the topic of producer surplus following the previous discussion on consumer surplus.
Explanation of the equilibrium price and quantity on a supply and demand graph.
Consumer surplus is represented by the area below the demand curve and above the price curve.
Producer surplus is the benefit sellers receive when the selling price exceeds their cost.
Supply curve reflects the lowest price producers are willing to accept to cover their costs.
Manufacturers will not sell below their cost to avoid losses.
Producers have a reservation price which is the minimum they will accept to sell their product.
High cost producers need to sell at higher prices to recover their costs.
Producer surplus is the area under the market price and above the supply curve.
Simple algebra can be used to calculate the values of consumer and producer surplus.
Key values needed for calculation include equilibrium price, quantity, and intersection points of supply and demand curves.
Upcoming week's content will cover algebraic calculation of producer and consumer surplus with real values.
Invitation for audience feedback on content and suggestions for future economic topics.
Closing remarks expressing gratitude for the channel's growth and subscriber support.
Transcripts
5.0 / 5 (0 votes)
Thanks for rating:


