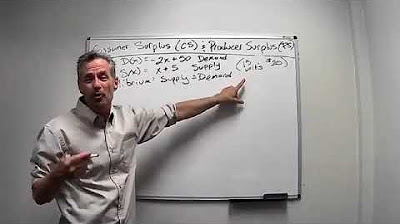
Math 11 - Section 5.1
TLDRIn this engaging lecture, Professor Monti delves into the concepts of consumer surplus and producer surplus, essential economic principles for understanding market equilibrium. He begins by illustrating the demand and supply curves, explaining how they intersect at the equilibrium point where the quantity demanded equals the quantity supplied. The professor then explores the total revenue represented by the area of a rectangle formed by price and quantity, and how it relates to consumer and producer surplus. Consumer surplus is defined as the additional money consumers are willing to spend but don't have to, while producer surplus is the additional profit producers gain beyond their minimum willingness to supply. Using the formulas for calculating these surpluses, the professor guides students through an example problem involving a demand curve (D of X = 1000 - 10X) and a supply curve (S of X = 250 + 5X), calculating the equilibrium point, consumer surplus, and producer surplus. This comprehensive overview not only imparts knowledge on economic surpluses but also equips students with the tools to apply these concepts in practical scenarios, fostering a deeper appreciation for the dynamics of supply and demand.
Takeaways
- 👨🏫 The video introduces the concept of consumer surplus and producer surplus, explaining their significance in economic transactions.
- 📌 Graphs are used to illustrate the relationship between price and quantity for both demand and supply curves, highlighting the equilibrium point where these curves intersect.
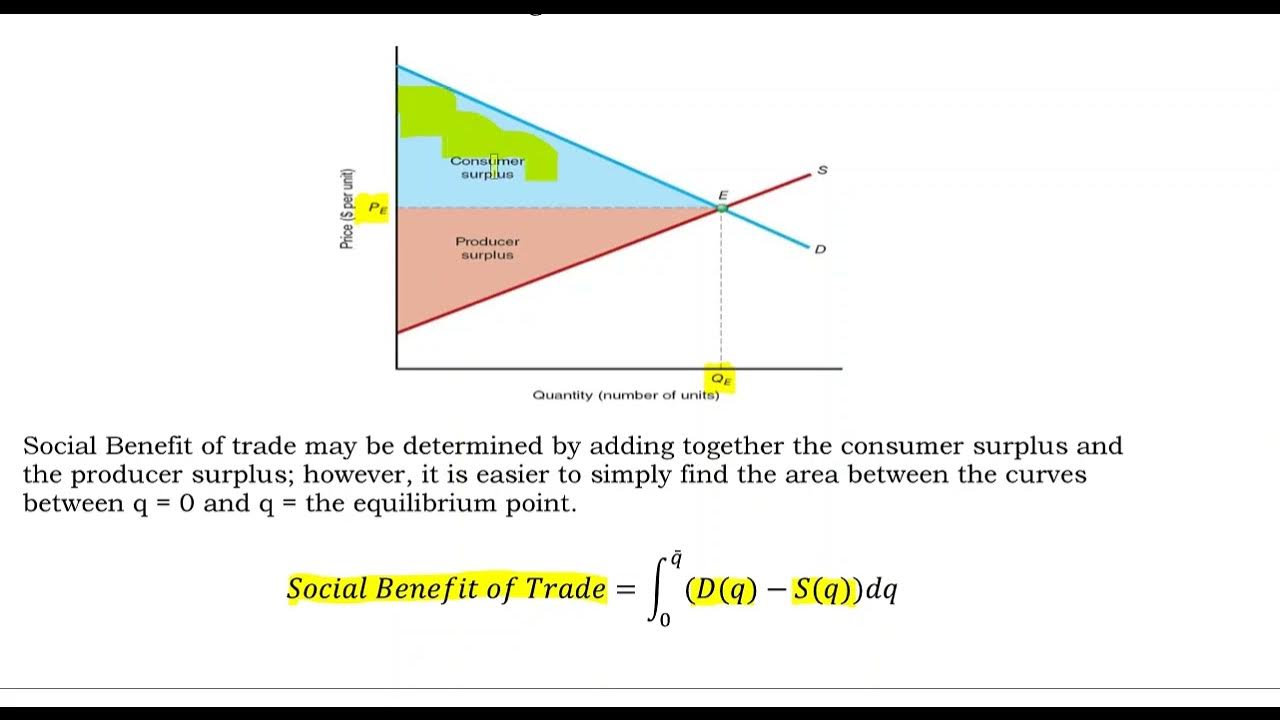
- ✅ Consumer surplus is described as the additional money that consumers were willing to spend but didn't have to, often illustrated by the area between the demand curve and the equilibrium price.
- 💰 Producer surplus is explained as the extra profit producers earn over what they were willing to accept, represented by the area above the supply curve up to the equilibrium price.
- ➡️ Total revenue in the market is shown as a box in the graph, calculated as the product of the equilibrium price and quantity.
- 📑 The formulas for calculating consumer and producer surplus involve integrating the demand and supply curves respectively, then subtracting the actual transaction amount.
- 🔨 The equilibrium point is found by setting the demand function equal to the supply function and solving for quantity, which also determines the equilibrium price.
- 📚 Practical examples, like the willingness to pay for a shirt or the bidding process on eBay, are used to make the concepts of consumer and producer surplus relatable and understandable.
- ✔️ The video concludes by solving a specific example problem that applies the discussed concepts to determine the equilibrium point, consumer surplus, and producer surplus.
- 📝 The lecturer emphasizes the importance of understanding these economic concepts not just for exams, but for practical decision-making in buying and selling scenarios.
Q & A
What is the concept of consumer surplus?
-Consumer surplus is the additional money that consumers were willing to spend on a product but did not have to. It is represented by the area under the demand curve from the equilibrium price to the point where the consumer is willing to buy the product.
How is the demand curve represented in the context of consumer surplus and producer surplus?
-The demand curve (D of X) is represented as a downward-sloping curve that shows the quantity demanded at various price levels. As the price decreases, the quantity demanded increases, forming a curve that starts at a high price with zero demand and slopes down to lower prices with increased demand.
What does the supply curve represent in the context of the equilibrium model?
-The supply curve (S of X) represents the quantity that producers are willing to supply at various price levels. At low prices, producers are not willing to supply any goods, but as the price increases, they are willing to supply more, forming an upward-sloping curve.
What is the equilibrium price in the context of the script?
-The equilibrium price is the price at which the quantity demanded by consumers equals the quantity supplied by producers. It is the point where the demand and supply curves intersect.
What is the formula for calculating consumer surplus?
-The formula for calculating consumer surplus is the integral of the demand curve from zero to the quantity demanded (Q) minus the total revenue (price times quantity) that consumers actually spent.
How is producer surplus defined in the script?
-Producer surplus is defined as the additional profit that producers gain from selling a product at the equilibrium price, which is higher than the minimum price they were willing to accept for the product.
What is the formula for calculating producer surplus?
-The formula for calculating producer surplus is the total revenue (price times quantity) minus the integral of the supply curve from zero to the quantity supplied (Q).
How does the script describe the process of finding the equilibrium point?
-The equilibrium point is found by setting the demand and supply equations equal to each other and solving for the quantity (X). Once the quantity is found, the equilibrium price is determined by substituting the quantity into either the demand or supply equation.
What is the example given in the script for the demand curve equation?
-The example given for the demand curve equation in the script is D of X = a thousand minus 10x.
What is the example given in the script for the supply curve equation?
-The example given for the supply curve equation in the script is S of X = 250 plus 5x.
How does the script illustrate the calculation of consumer surplus in the example problem?
-The script calculates consumer surplus by integrating the demand curve equation from 0 to 50 (the equilibrium quantity) and subtracting the total revenue (500 * 50) from this integral.
How does the script illustrate the calculation of producer surplus in the example problem?
-The script calculates producer surplus by taking the total revenue (500 * 50) and subtracting the integral of the supply curve equation from 0 to 50 (the equilibrium quantity).
Outlines
📈 Introduction to Consumer and Producer Surplus
Professor Monti introduces the concept of consumer and producer surplus in the context of a market equilibrium. He explains the demand and supply curves, how they intersect at equilibrium price and quantity, and the significance of total revenue represented by the area of a rectangle formed by price and quantity. The equilibrium point is where the quantity demanded by consumers equals the quantity supplied by producers.
💰 Consumer Surplus and Its Significance
The second paragraph delves into consumer surplus, which is the difference between what consumers are willing to pay and what they actually pay at the equilibrium price. It is illustrated as the area above the supply curve and below the demand curve, representing the additional money consumers are willing to spend but do not have to. An example is given comparing it to a sale where a consumer is willing to pay more than the sale price, thus receiving consumer surplus.
📊 Producer Surplus and Its Calculation
Producer surplus is the focus of the third paragraph. It is defined as the additional profit producers make because they receive the equilibrium price, which is higher than the minimum they are willing to accept for each unit. The concept is explained with examples, including oil production and baking cookies. The producer surplus is the area above the supply curve and below the equilibrium price line, representing the extra profit producers earn.
🧮 Formulas for Calculating Surpluses
The fourth paragraph provides the formulas for calculating both consumer and producer surplus. Consumer surplus is calculated as the integral under the demand curve minus the total revenue (price times quantity), while producer surplus is the total revenue minus the integral under the supply curve. The paragraph emphasizes the importance of understanding the concepts behind these formulas rather than just memorizing them.
🔍 Finding Equilibrium and Interpreting Surpluses
In the fifth paragraph, the process of finding the equilibrium point where demand equals supply is demonstrated using a given demand curve (D of X) and supply curve (S of X). The equilibrium point is calculated, and then the consumer surplus is interpreted as the additional amount consumers were willing to spend but did not have to, due to the equilibrium price. The calculation involves integrating the demand curve and subtracting the area of the revenue box.
📉 Calculating and Understanding Producer Surplus
The sixth and final paragraph focuses on calculating the producer surplus. It is the total revenue minus what the producers were willing to accept, which is found by integrating the supply curve. An example calculation is provided, resulting in the producer surplus being the difference between the revenue and the area under the supply curve. The paragraph concludes with encouragement to understand the economic application of these concepts for better problem-solving.
Mindmap
Keywords
💡Consumer Surplus
💡Producer Surplus
💡Demand Curve
💡Supply Curve
💡Equilibrium Price
💡Total Revenue
💡Integral
💡Economic Equilibrium
💡Price Ceiling
💡Quantity Demanded
💡Quantity Supplied
Highlights
Introduction to the concepts of consumer surplus and producer surplus in the context of economic equilibrium.
Explanation of the demand curve, showing how quantity demanded increases as price decreases.
Description of the supply curve, illustrating how producers are willing to supply more as the price increases.
Identification of the equilibrium point where quantity demanded equals quantity supplied at a given price.
Total revenue is calculated as price times quantity, forming a rectangle in the graph representing all transactions.
Consumer surplus is defined as the additional money consumers are willing to spend but do not have to due to the equilibrium price.
Producer surplus is the additional profit producers make beyond their minimum willingness to supply at the equilibrium price.
Consumer surplus is calculated as the integral under the demand curve minus the total revenue.
Producer surplus is determined by subtracting the area under the supply curve from the total revenue.
Practical example given to illustrate consumer surplus using a shirt sale scenario.
eBay bidding strategy used as an analogy to explain consumer surplus.
Explanation of how producers increase supply in response to higher prices, using the example of oil production and baking cookies.
Mathematical formulas for calculating consumer and producer surplus using integral calculus.
Example problem provided to demonstrate how to find the equilibrium point, consumer surplus, and producer surplus.
Solution to the example problem, integrating the demand and supply curves to find the surpluses at equilibrium.
Emphasis on understanding the economic concepts behind the formulas rather than just memorizing them.
Advice for students on how to approach problems involving equilibrium, consumer surplus, and producer surplus.
Encouragement for students to practice these concepts to prepare for final assessments.
Closing remarks and congratulations to students for completing the material, with an invitation to review and master the concepts.
Transcripts
Browse More Related Video

What is Consumers Surplus and Producer Surplus?
Consumer Surplus (CS) and Producer Surplus (PS) Example

Consumer Surplus and Producer Surplus
Social Benefit of Trade (Gains from Trade)
Consumers' Surplus Producers' Surplus from given Demand and Supply functions
Consumer and Producer Surplus (KristaKingMath)
5.0 / 5 (0 votes)
Thanks for rating: