Consumer Surplus and Producer Surplus
TLDRThis video script delves into the concepts of consumer and producer surplus in a market equilibrium. It explains how consumer surplus is the additional benefit consumers receive when they pay less than they are willing to for a good, graphically represented as the area below the demand curve above the equilibrium price. Producer surplus, on the other hand, is the extra benefit producers gain by selling at a higher price than their minimum willingness, shown as the area above the supply curve below the equilibrium price. Both surpluses contribute to total welfare, which is maximized at market equilibrium, reflecting an efficient allocation of resources.
Takeaways
- 📚 Consumer surplus is the additional benefit consumers receive when they pay less than what they are willing to pay for a good.
- 💰 Producer surplus is the additional benefit producers receive when they sell a product at a price higher than what they are willing to sell it for.
- 📈 The market equilibrium price and quantity are efficient because they equalize the marginal benefit to consumers and the marginal cost to producers.
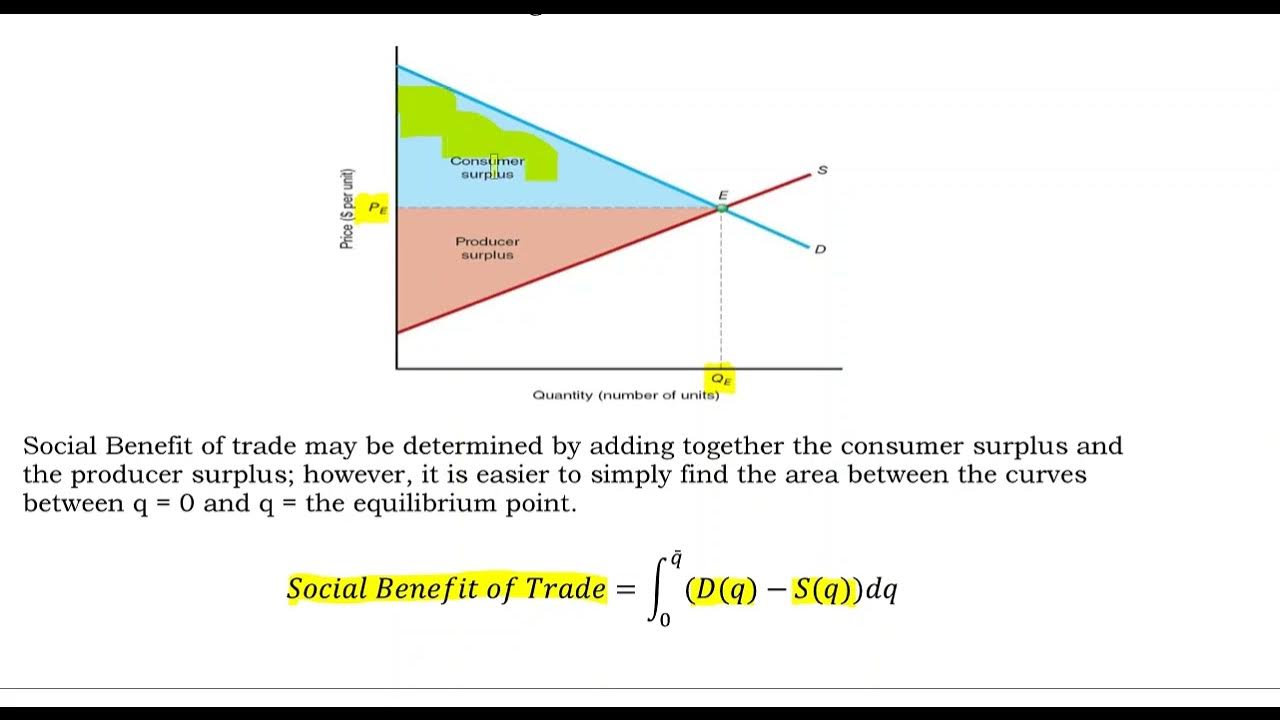
- 🐂 In the beef market example, consumer surplus is represented by the area below the demand curve and above the equilibrium price.
- 🌾 Producer surplus in the beef market is represented by the area above the supply curve and below the equilibrium price.
- 🔍 The demand curve shows the willingness to pay of all consumers for a good at different prices.
- 📊 The supply curve represents the willingness of producers to supply the good at different prices, with the most efficient producers at the lower end.
- 🤔 Consumer surplus is experienced by consumers who are willing to pay more than the actual market price.
- 💼 Producer surplus is experienced by producers who are able to sell at a higher price than their cost of production.
- 📉 Surplus in economics can also refer to excess supply, which is an inefficient allocation of resources and should be avoided.
- 🌟 At the market equilibrium, both consumer and producer surplus are maximized, leading to the highest total welfare or community surplus.
Q & A
What are consumer surplus and producer surplus?
-Consumer surplus is the additional benefit consumers enjoy when they pay less than the price they were willing to pay for a good. Producer surplus is the additional benefit producers enjoy when they sell a product at a price higher than what they were willing to sell for.
How is consumer surplus represented in a market diagram?
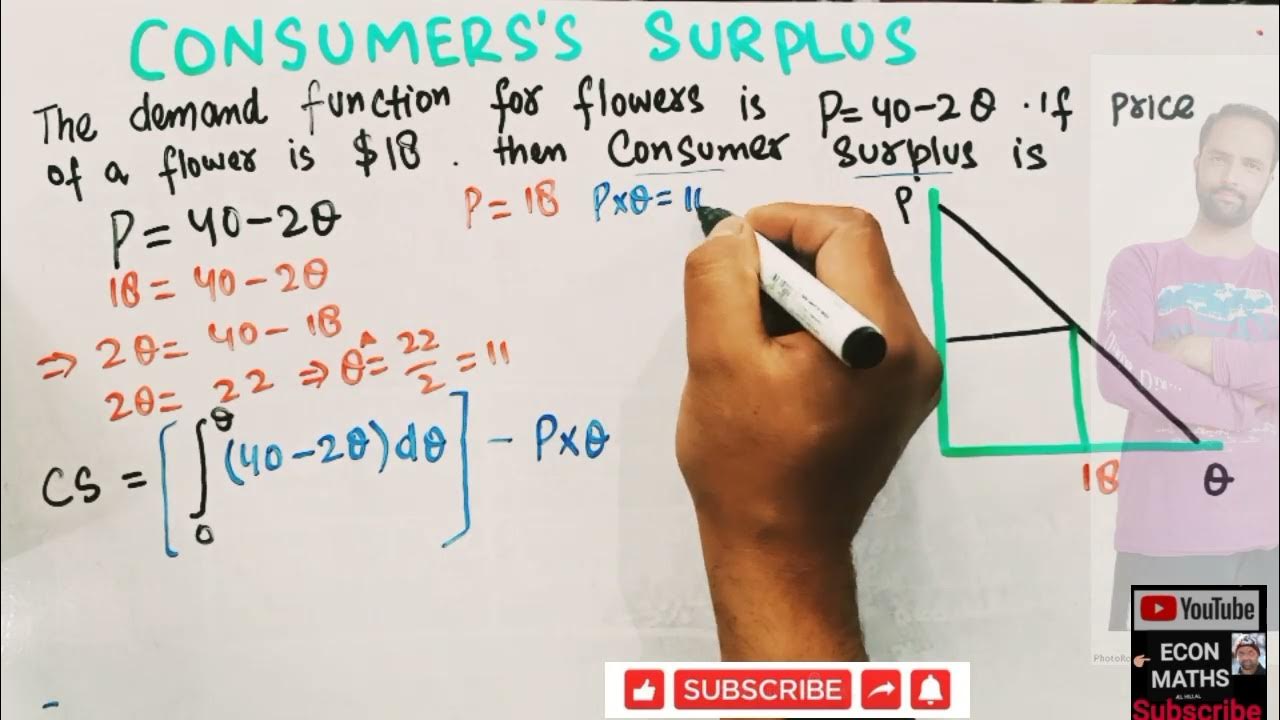
-Consumer surplus is represented graphically by the area below the demand curve and above the equilibrium price, indicating the extra benefit or happiness experienced by consumers who bought the good at a price lower than they were willing to pay.
What is the technical definition of consumer surplus?
-The technical definition of consumer surplus is the additional benefit enjoyed by consumers who pay less than they are willing and able to pay for a good.
In the context of the beef market, how is consumer surplus illustrated?
-In the beef market, consumer surplus is illustrated by the area below the demand curve for beef and above the equilibrium price, representing the additional benefit enjoyed by consumers who are willing to pay more than the actual price of beef.
What does the demand curve represent in a market?
-The demand curve represents the willingness to pay of all consumers in the market for a good at a range of prices, with those willing to pay the most represented by points higher on the curve.
How is producer surplus related to profit in a market?
-Producer surplus is essentially another term for profit in a market, as it represents the additional benefit producers receive from selling at a price higher than their minimum willingness to sell.
What is the graphical representation of producer surplus in a market diagram?
-Producer surplus is graphically represented by the area above the supply curve and below the equilibrium price, indicating the additional benefit enjoyed by producers who are willing to sell their goods at a price lower than the equilibrium price.
How does the efficiency of cattle farmers affect their producer surplus?
-More efficient and productive cattle farmers, who can produce beef at a lower marginal cost, earn more producer surplus when they sell beef at the equilibrium price compared to less efficient farmers with higher costs.
What is the difference between the surplus discussed in the equilibrium video and the surplus in consumer and producer surplus?
-The surplus in the equilibrium video refers to an excess supply of goods, which is inefficient and should be avoided. In contrast, consumer and producer surplus refer to the extra happiness or benefits enjoyed by consumers and producers at the equilibrium price and quantity, which should be maximized for total welfare.
What is the relationship between equilibrium price and quantity and the maximization of consumer and producer surplus?
-At the equilibrium price and quantity, the marginal benefit to consumers equals the marginal cost faced by producers, resulting in the maximization of both consumer and producer surplus, which contributes to the maximization of total welfare.
Why is it important to maximize total welfare in a market?
-Maximizing total welfare is important because it ensures that both consumers and producers are better off, reflecting an efficient allocation of resources and overall well-being in the market.
Outlines
💰 Understanding Consumer and Producer Surplus
This paragraph introduces the fundamental economic concepts of consumer and producer surplus within a market for a specific good. The script explains that consumer surplus is the additional benefit consumers experience when they pay less than they are willing to for a good, and it is graphically represented by the area below the demand curve and above the equilibrium price. The video script uses the market for beef as an example to illustrate how consumer surplus can be calculated and the benefits it brings to consumers. It also touches on the concept of producer surplus, which is the additional benefit producers enjoy when they sell a good at a higher price than they are willing to accept, and is represented by the area above the supply curve and below the equilibrium price. The paragraph emphasizes that both consumer and producer surplus are maximized at the market equilibrium, which is an efficient allocation of resources.
🌟 Maximizing Welfare Through Equilibrium
The second paragraph delves deeper into the concept of producer surplus, explaining that it is similar to consumer surplus but from the perspective of sellers. It uses the example of cattle farmers with varying costs of production to illustrate how different producers may experience different levels of surplus. The paragraph clarifies that the total producer surplus is represented by the area below the equilibrium price and above the supply curve. It also distinguishes between the term 'surplus' used in the context of excess supply, which is undesirable, and producer surplus, which is a measure of the additional benefit to producers. The script concludes by emphasizing the importance of maximizing total welfare, which is the sum of consumer and producer surplus, at the market equilibrium, as this represents the most efficient and beneficial state for both consumers and producers.
Mindmap
Keywords
💡Consumer Surplus
💡Producer Surplus
💡Equilibrium Price
💡Equilibrium Quantity
💡Marginal Benefit
💡Marginal Cost
💡Demand Curve
💡Supply Curve
💡Total Welfare
💡Efficiency
💡Profit
Highlights
Introduction to the concepts of consumer and producer surplus in a market.
Explanation of equilibrium price and quantity as the most efficient in a market.
Definition of consumer surplus as the additional benefit when consumers pay less than they are willing to.
Illustration of consumer surplus on a market diagram for beef.
Technical definition of consumer surplus and its graphical representation.
Discussion on the willingness to pay and marginal benefits of consumers.
Graphical representation of consumer surplus as a yellow triangle on the diagram.
Introduction to producer surplus as the additional benefit for producers selling at a higher price than their willingness.
Definition of producer surplus and its relation to profit in a market.
Assumption of varying costs among cattle farmers and its impact on producer surplus.
Graphical representation of producer surplus as a purple triangle on the diagram.
Clarification of surplus in economics and its avoidance in efficient resource allocation.
Distinguishing between surplus as inefficiency and surplus as extra happiness for consumers and producers.
Maximization of consumer and producer surplus at equilibrium price and quantity.
Introduction of the concept of total welfare and its maximization at market equilibrium.
Explanation of how equilibrium maximizes welfare and benefits both consumers and producers.
Transcripts
Browse More Related Video
5.0 / 5 (0 votes)
Thanks for rating:


