Precalc 5.5 Day 2 Notes
TLDRThis video explains how to write equations for sine and cosine functions using a given graph. The key steps involve identifying the amplitude, period, and phase shift from the graph. The amplitude is found by observing the graph's highest and lowest points. The period helps determine the value of B, using the formula 2π divided by the period. The phase shift indicates where the graph starts relative to the origin. The video covers examples, illustrating how to derive the equations for sine and cosine functions from different graphs.
Takeaways
- 📚 The video is a tutorial on writing equations for sine and cosine functions based on their graphs.
- 🔍 To write the equations, three key elements from the graph must be identified: amplitude, period, and phase shift.
- 📏 Amplitude (a) is the peak value of the graph and is found by looking at the highest and lowest points on the y-axis.
- ⏳ The period (B) is the length of one complete cycle of the function and can be calculated using the formula 2π/B.
- 🔄 The phase shift (C) is the horizontal shift of the graph from its standard position and is found by identifying the least positive number that shifts the graph to align with the standard position.
- 📈 The graph's x-axis is often scaled in terms of π, but it can also be scaled in other units, which must be considered when analyzing the graph.
- 📉 The y-axis scale is crucial for determining the amplitude of the function, which is the maximum and minimum values the graph reaches.
- 🔢 The amplitude, period, and phase shift values are used to construct the sine and cosine equations in the form y = a * sin(Bx + C) or y = a * cos(Bx + C).
- 🌀 The difference between sine and cosine functions in the context of the graph is the phase shift, which affects when the function starts its cycle.
- 📌 When writing the equation for sine, the phase shift is subtracted from the x value in the function (i.e., x - C).
- 📊 For cosine, the phase shift is added to the x value in the function (i.e., x + C), reflecting the starting point of the cosine cycle.
Q & A
What are the three key elements needed to write equations for sine and cosine functions from a graph?
-The three key elements needed are the amplitude (a), the period (B), and the phase shift (C).
How is the amplitude of a trigonometric function determined from its graph?
-The amplitude is determined by the maximum or minimum value of the function, which is the highest or lowest point on the graph.
What is the relationship between the period of a trigonometric function and the coefficient B in its equation?
-The period of the function is found by taking 2π divided by B. This relationship is used to solve for B when the period is known.
How does the phase shift affect the equation of a trigonometric function?
-The phase shift affects the equation by determining what goes inside the parenthesis with the variable x. It represents the horizontal shift of the function.
What is the significance of labeling the x and y-axis when analyzing a trigonometric graph?
-Labeling the axes helps in understanding the scale and the values that each tick mark represents, which is crucial for determining the amplitude, period, and phase shift.
How do you find the period of a sine or cosine function from its graph?
-The period is found by identifying one full cycle of the function, either sine or cosine, and measuring the distance along the x-axis from one peak to the next or from one zero crossing to the next.
What is the difference between the phase shift for sine and cosine functions in terms of their graphical representation?
-The phase shift for sine is determined by the horizontal shift needed to align the starting point of the sine wave with the x-axis, while the phase shift for cosine is determined by the horizontal shift needed to align the peak of the cosine wave with the y-axis.
How can you determine the equation of a sine function from a given graph?
-You determine the amplitude (a), find the period to solve for B, and identify the phase shift (C). The equation is then written as y = a * sin(Bx + C).
What is the equation for a cosine function with an amplitude of 5, a period of 2 units, and a phase shift of -1?
-The equation is y = 5 * cos(πx + π), where π is used instead of 2π/B since B = π.
How do you handle a situation where the B value in the trigonometric function equation is not a simple number but involves π?
-You can directly use π in the equation, as shown in the example where B = π, and the equation becomes y = 5 * cos(πx + π).
Outlines
📐 Introduction to Writing Equations from a Graph
This paragraph introduces the topic of writing equations for sine and cosine functions when given a graph. It outlines the three key components needed: amplitude, period, and phase shift. The amplitude helps determine 'a', the period helps solve for 'B', and the phase shift informs what goes inside the parentheses with 'x'. The paragraph also explains the importance of labeling the axes based on the scale provided in the graph.
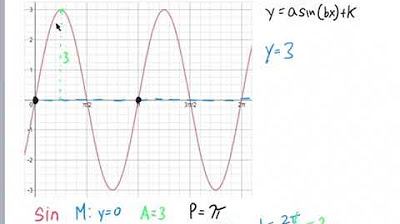
📊 Finding Amplitude and Period
This section explains how to determine the amplitude and period from the graph. The amplitude is found by observing the highest and lowest points of the graph, which in this example is 3. The period, which represents one full cycle of the sine function, is determined by the distance from -π to π, giving a period of 2π. The paragraph details the calculation of 'B' using the period, resulting in B=1. It also begins discussing the phase shift for sine.
📈 Phase Shift and Writing the Sine Equation
The paragraph continues from the previous explanation, focusing on finding the phase shift for sine. It identifies the phase shift as -π and uses this to write the equation for sine: y = 3sin(x + π). The paragraph then shifts to finding a cycle for cosine, explaining that normally cosine starts at a peak and details the phase shift calculation for cosine as -π/2. The cosine equation is then written as y = 3cos(x + π/2).
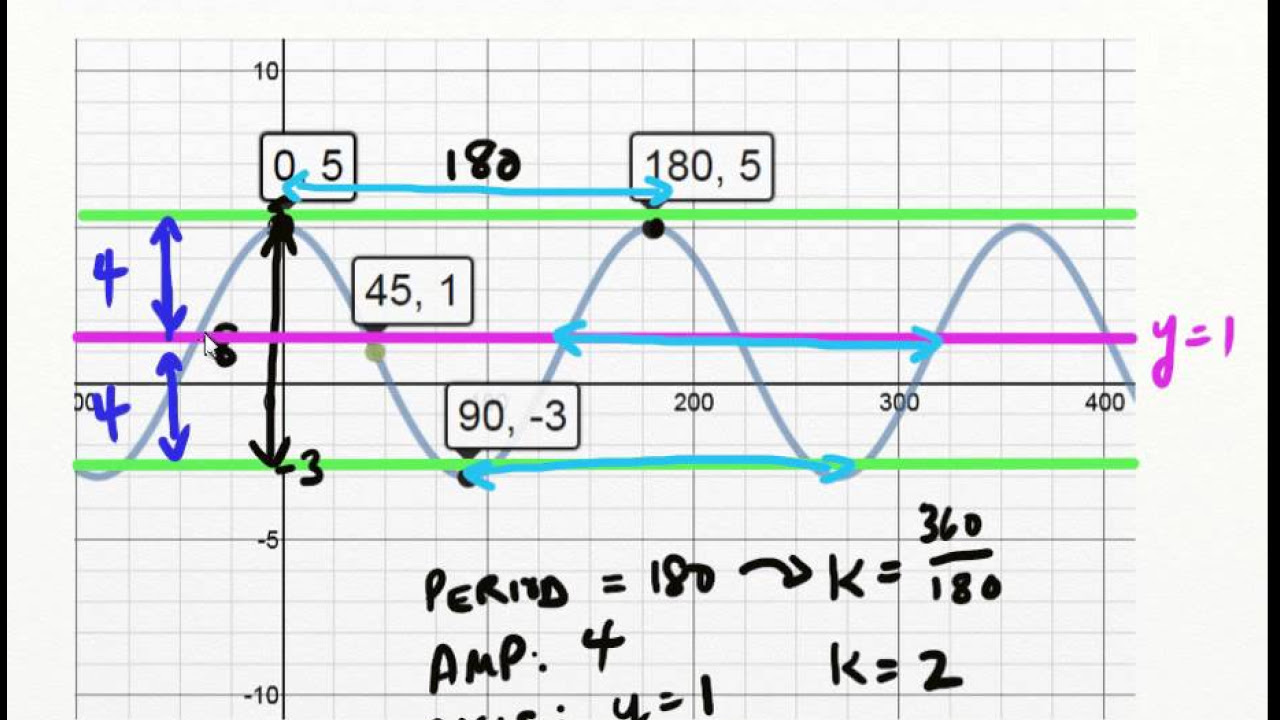
📏 Labeling Axes and Finding New Amplitude
This paragraph describes a different graph with x-axis scaled from -4 to 4 and y-axis from -6 to 6. It discusses the importance of labeling all tick marks for clarity. The amplitude is identified as 5 by observing the highest point of the graph.
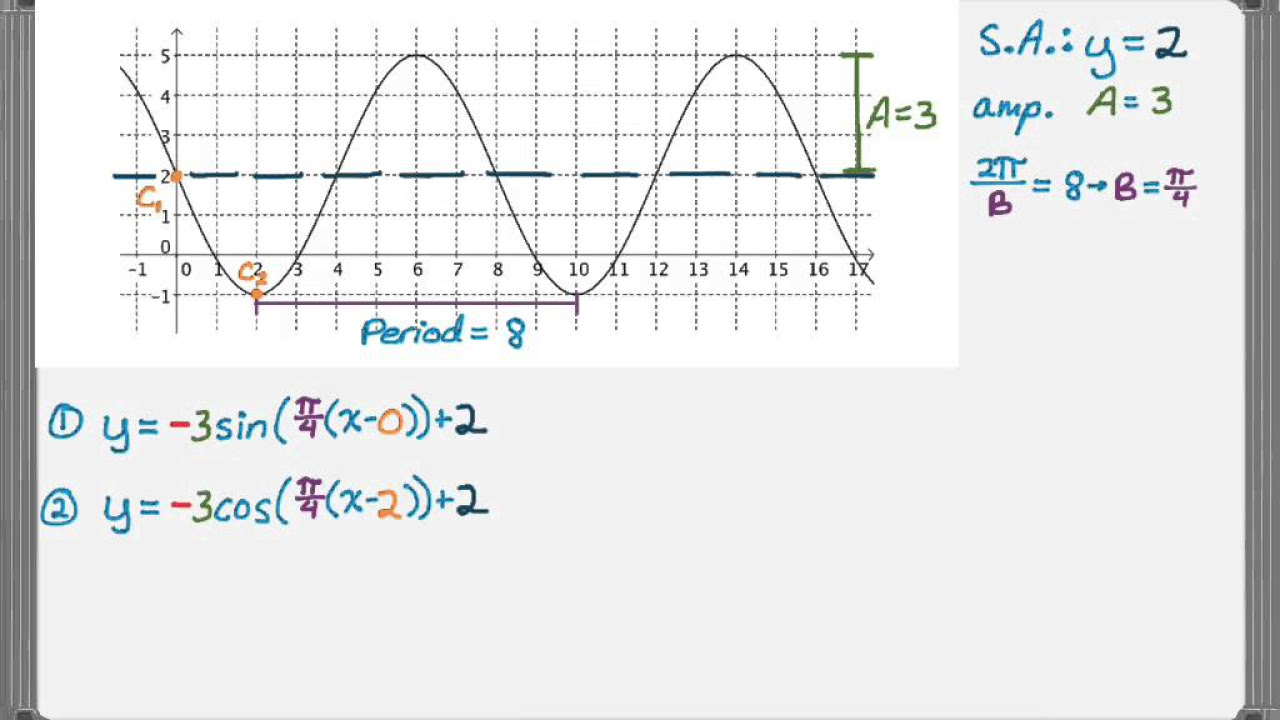
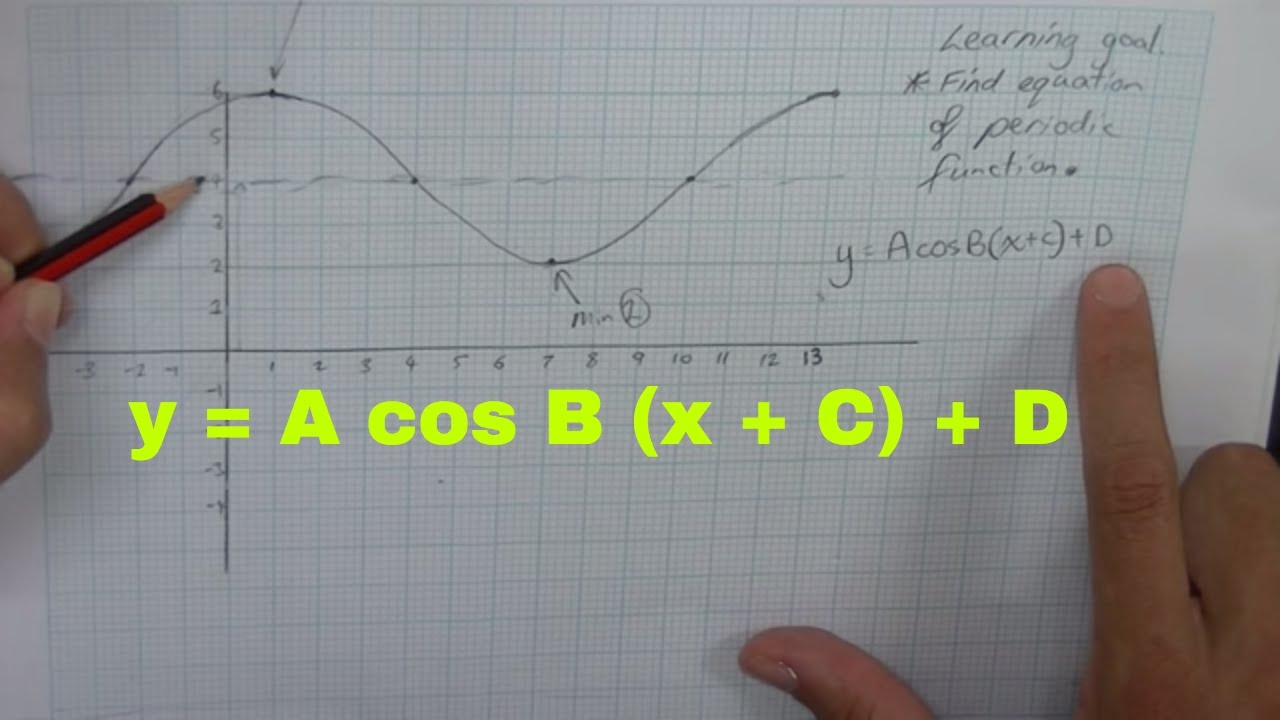
🧮 Calculating Period and Phase Shift for Cosine
This section focuses on finding the period and phase shift for a cosine function. It identifies the period as the distance between -1 and 1, giving a period of 2 units. This is used to solve for 'B', resulting in B = π. The phase shift for cosine is found to be -1, leading to the equation y = 5cos(πx + π).
🔄 Phase Shift and Writing the Sine Equation
This paragraph focuses on determining the phase shift for the sine function. It finds the phase shift to be -1.5, which is written as -3/2. The equation for sine is then written as y = 5sin(πx + 3π/2). The paragraph concludes by summarizing the equations for both sine and cosine for this particular graph.
Mindmap
Keywords
💡Amplitude
💡Period
💡Phase Shift
💡Sine Function
💡Cosine Function
💡Cycle
💡Graph Scaling
💡B Value
💡A Value
💡C Value
Highlights
Introduction to writing equations for sine and cosine functions given a graph.
Key parameters to find from the graph: amplitude, period, and phase shift.
Amplitude helps determine 'a', the coefficient in front of the trig function.
Period is used to solve for 'B', the coefficient in front of the variable inside the trig function.
Explanation of labeling the X and Y axes based on the scale provided.
Identification of amplitude from the graph: the highest and lowest points indicate the amplitude.
Method to find the period: looking for one full cycle of the sine or cosine function.
Example showing a sine function cycle from negative pi to positive pi, with a period of 2 pi.
Calculation of 'B' from the period using the formula 2 pi / B.
Discussion of phase shift and its impact on the sine and cosine graphs.
Example phase shift for sine, indicating a shift to negative pi.
Writing the equation for sine: y = 3 sin(x + pi).
Finding the phase shift for cosine, showing a shift to negative pi/2.
Writing the equation for cosine: y = 3 cos(x + pi/2).
Example with a different scaling on the X-axis: from -4 to 4.
Identifying amplitude from the second graph as 5.
Finding the period for the second graph using a cycle of cosine, resulting in a period of 2 units.
Calculation of 'B' for the second graph: B = pi.
Phase shift for cosine in the second example: negative 1.
Writing the equation for cosine with the new values: y = 5 cos(pi x + pi).
Finding the phase shift for sine in the second example: negative 3/2.
Writing the equation for sine with the new values: y = 5 sin(pi x + 3pi/2).
Summary of steps to write sine and cosine equations from graphs.
Emphasis on the importance of labeling axes and identifying key parameters accurately.
Transcripts
Browse More Related Video


5.0 / 5 (0 votes)
Thanks for rating: