consumer surplus and producer surplus
TLDRThis instructional video script guides viewers through the process of calculating consumer and producer surplus using a given demand and supply functions. It demonstrates how to find the equilibrium price and quantity by setting the two functions equal to each other and solving the resulting quadratic equation. The script then explains how to calculate consumer surplus as the area between the demand curve and the equilibrium price, and producer surplus as the area between the supply curve and the equilibrium price, using definite integrals and total expenditure. The video concludes with the calculated surplus values, providing a clear example of economic surplus analysis.
Takeaways
- 📚 The video is a tutorial on calculating consumer and producer surplus using a given example with demand and supply functions.
- 🔍 The demand function is given as p = 18 - 2Q, and the supply function as p = 2Q - 3.
- ⚖️ To find equilibrium, the demand and supply functions must be equalized, leading to a quadratic equation.
- 📈 The equilibrium is graphically represented by the intersection of the demand and supply curves on a price-quantity graph.
- 🧩 After solving the quadratic equation, the equilibrium quantity Q is found to be 3, which is feasible since quantity cannot be negative.
- 💰 The equilibrium price P is calculated by substituting the equilibrium quantity into either the demand or supply function, resulting in 3.
- 🛒 Consumer surplus is the difference between what consumers are willing to pay and what they actually pay, represented by the area above the equilibrium price and below the demand curve.
- 📊 To calculate consumer surplus, integrate the demand function from 0 to the equilibrium quantity and subtract the total expenditure P × Q.
- 📘 The formula for consumer surplus is applied, and the calculation yields a consumer surplus of 27.
- 🚚 Producer surplus is the difference between the price a producer is willing to accept and the actual price received, represented by the area below the equilibrium price and above the supply curve.
- 📋 The producer surplus is calculated by subtracting the integral of the supply function from the total revenue P × Q, resulting in a producer surplus of 9.
Q & A
What are consumer surplus and producer surplus?
-Consumer surplus is the difference between the price consumers are willing to pay and the actual price they pay for a product. Producer surplus is the difference between the price producers receive for a product and the price they are willing to accept.
What is the given demand function in the script?
-The given demand function is p = 18 - 2Q.
What is the given supply function in the script?
-The given supply function is p = 2Q - 3.
How do you find the equilibrium quantity and price?
-To find the equilibrium quantity and price, you equate the demand function to the supply function and solve for Q. Then substitute Q back into either the demand or supply function to find the equilibrium price.
What is the equilibrium quantity in the given example?
-The equilibrium quantity in the given example is Q = 3.
What is the equilibrium price in the given example?
-The equilibrium price in the given example is p = 3.
How is the total expenditure calculated in the context of consumer surplus?
-The total expenditure (P * Q) is calculated by multiplying the equilibrium price by the equilibrium quantity.
What is the formula for calculating consumer surplus?
-The formula for calculating consumer surplus is the definite integral from 0 to the equilibrium quantity of the demand function, minus the total expenditure (P * Q).
What is the consumer surplus in the given example?
-The consumer surplus in the given example is 27.
How is the producer surplus graphically represented?
-Graphically, the producer surplus is represented by the area below the equilibrium price and above the supply curve.
What is the producer surplus in the given example?
-The producer surplus in the given example is 9.
How do you calculate the producer surplus in the given example?
-To calculate the producer surplus, subtract the definite integral from 0 to the equilibrium quantity of the supply function from the total revenue (P * Q).
Outlines
📚 Introduction to Calculating Consumer and Producer Surplus
This paragraph introduces the topic of calculating consumer and producer surplus using a given demand and supply function. The demand function is described as p = 18 - 2Q, and the supply function as p = 2Q - 3. The goal is to find the equilibrium where demand equals supply, which is done by setting the two functions equal to each other and solving for Q. A graphical representation is suggested, with the demand and supply curves plotted on a graph with quantity on the horizontal axis and price on the vertical axis. The equilibrium price and quantity are then calculated by solving the equation derived from setting the demand and supply functions equal to each other.
📈 Graphical Explanation and Calculation of Equilibrium
The paragraph explains the process of finding the equilibrium graphically and algebraically. It describes the demand function as nonlinear and the supply function as upward sloping. The equilibrium is found by solving the equation 18 - 2Q = 2Q - 3, which simplifies to a quadratic equation 4Q - 21 = 0. The solution to this equation gives Q = 3, which is the equilibrium quantity. The equilibrium price is then found by substituting Q = 3 into either the demand or supply function, resulting in P = 3. The paragraph also clarifies that the negative solution for Q is discarded because quantity cannot be negative.
💰 Calculating Consumer Surplus with an Example
This paragraph delves into the calculation of consumer surplus. Consumer surplus is defined as the difference between what consumers are willing to pay and what they actually pay, represented graphically as the area above the equilibrium price and below the demand curve. The formula for calculating consumer surplus is given by the integral of the demand function from 0 to the equilibrium quantity, minus the total expenditure (P*Q). The demand function is differentiated and integrated, and the resulting values are evaluated at the equilibrium quantity and at 0. The total expenditure is calculated as 9, and the consumer surplus is found to be 27 after performing the integration and subtraction.
🏭 Calculating Producer Surplus and Concluding the Video
The final paragraph discusses the concept of producer surplus, which is the difference between the price a seller is willing to accept and the actual price received. Graphically, it is represented as the area below the equilibrium price and above the supply curve. The calculation of producer surplus involves subtracting the integral of the supply function from the total revenue (P*Q). The supply function is integrated, and the values are evaluated at the equilibrium quantity and at 0. The total revenue is 9, and after performing the integration and subtraction, the producer surplus is found to be 9. The video concludes with a summary of the findings and a thank you note to the viewers.
Mindmap
Keywords
💡Consumer Surplus
💡Producer Surplus
💡Demand Function
💡Supply Function
💡Equilibrium
💡Price
💡Quantity
💡Integral
💡Total Expenditure
💡Quadratic Function
💡Graphical Representation
Highlights
The video teaches how to calculate consumer and producer surplus using a given demand and supply function.
Demand function is defined as p = 18 - 2Q, and supply function is p = 2Q - 3.
Equilibrium is found by setting the demand function equal to the supply function.
Graphical representation of demand and supply functions on a price-quantity graph is explained.
The equilibrium quantity is calculated to be 3 by solving the quadratic equation.
The equilibrium price is determined to be 3 by substituting the equilibrium quantity into the supply function.
Total expenditure (P*Q) at equilibrium is calculated to be 9.
Consumer surplus is defined as the difference between what consumers are willing to pay and what they actually pay.
The formula for calculating consumer surplus is introduced, involving an integral of the demand function.
Consumer surplus is represented as the area between the demand curve and the equilibrium price.
The calculation of consumer surplus results in a value of 27.
Producer surplus is the difference between the price a producer is willing to accept and the actual price received.
Producer surplus is graphically represented as the area below the equilibrium price and above the supply curve.
The formula for calculating producer surplus involves the total revenue minus an integral of the supply function.
The calculation of producer surplus results in a value of 9.
The video concludes with a clear explanation of both consumer and producer surplus calculations.
Transcripts
Browse More Related Video
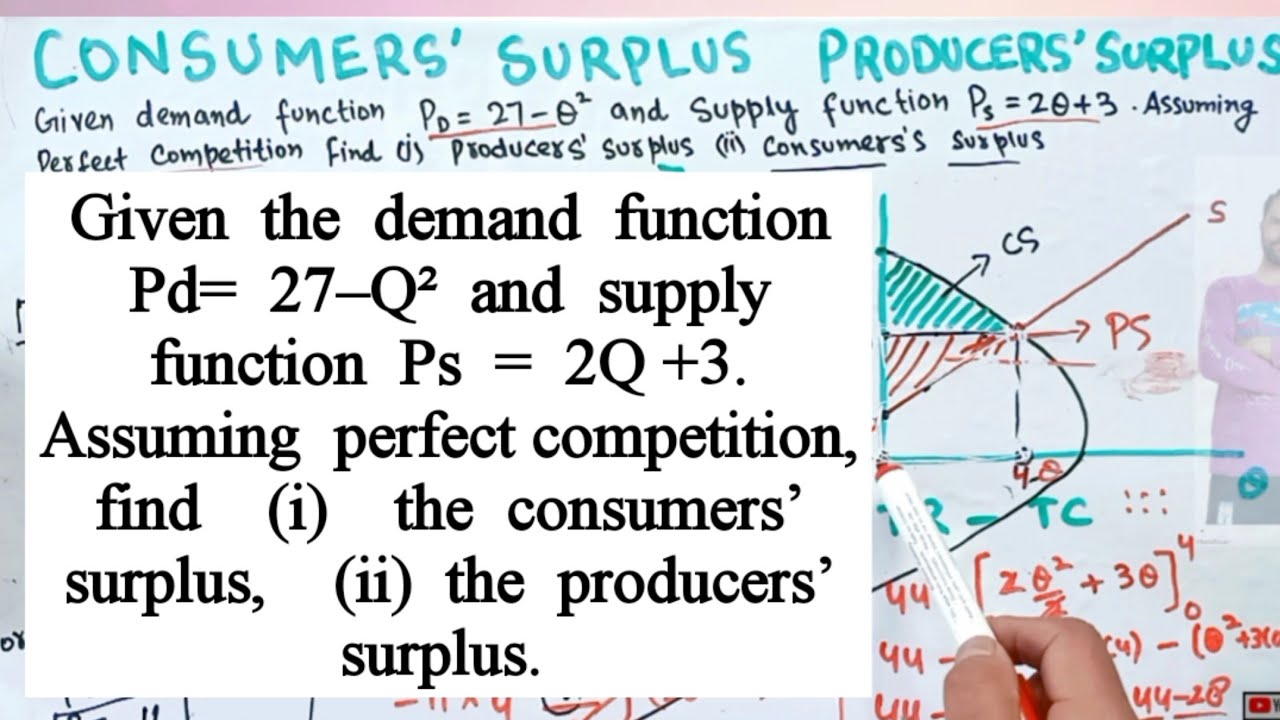
Consumers' Surplus Producers' Surplus from given Demand and Supply functions
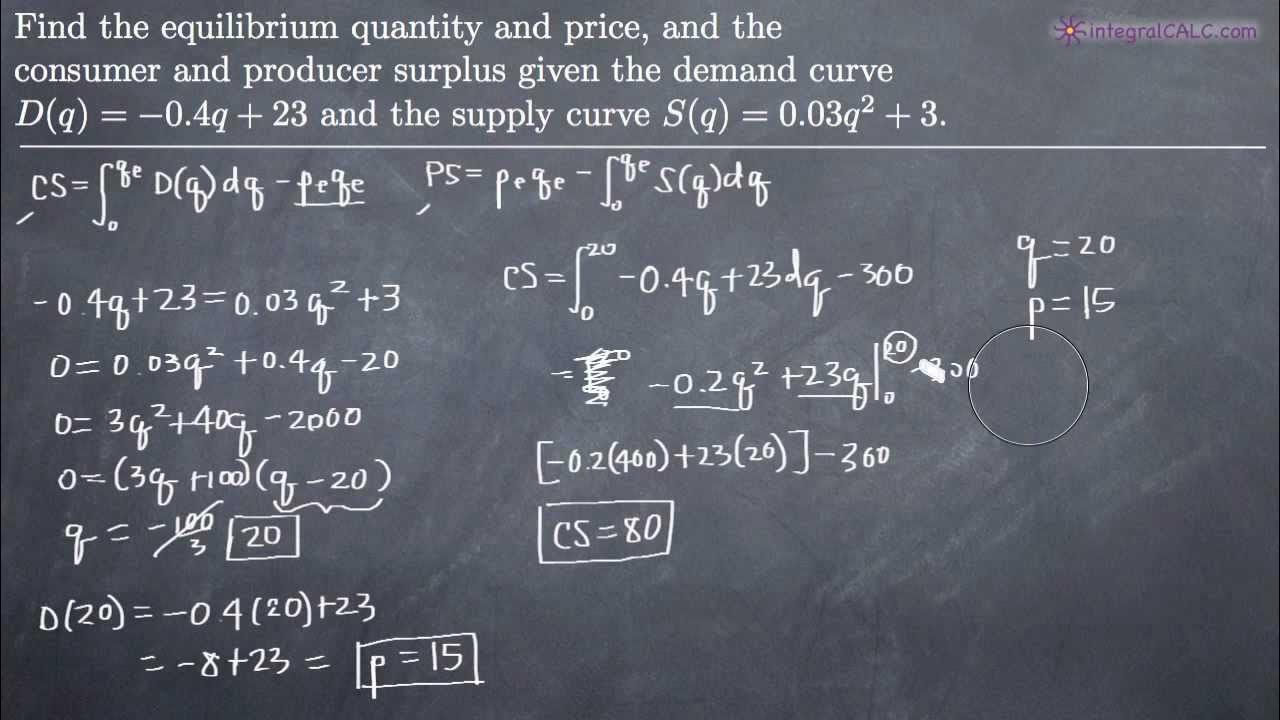
Consumer and Producer Surplus (KristaKingMath)

Consumer-Producer Surplus (p. 476 #10 )

What is Consumers Surplus and Producer Surplus?
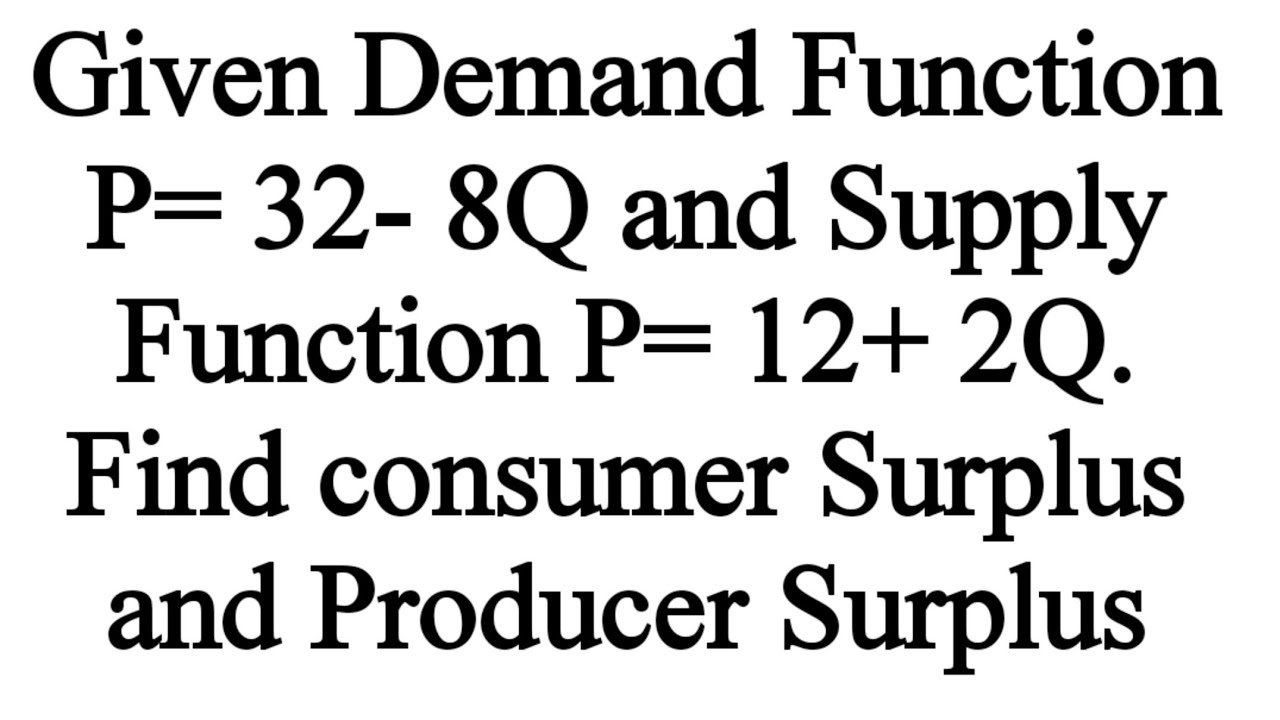
Consumers' Surplus , Producers' Surplus & Total Surplus from demand & supply Functions #PS
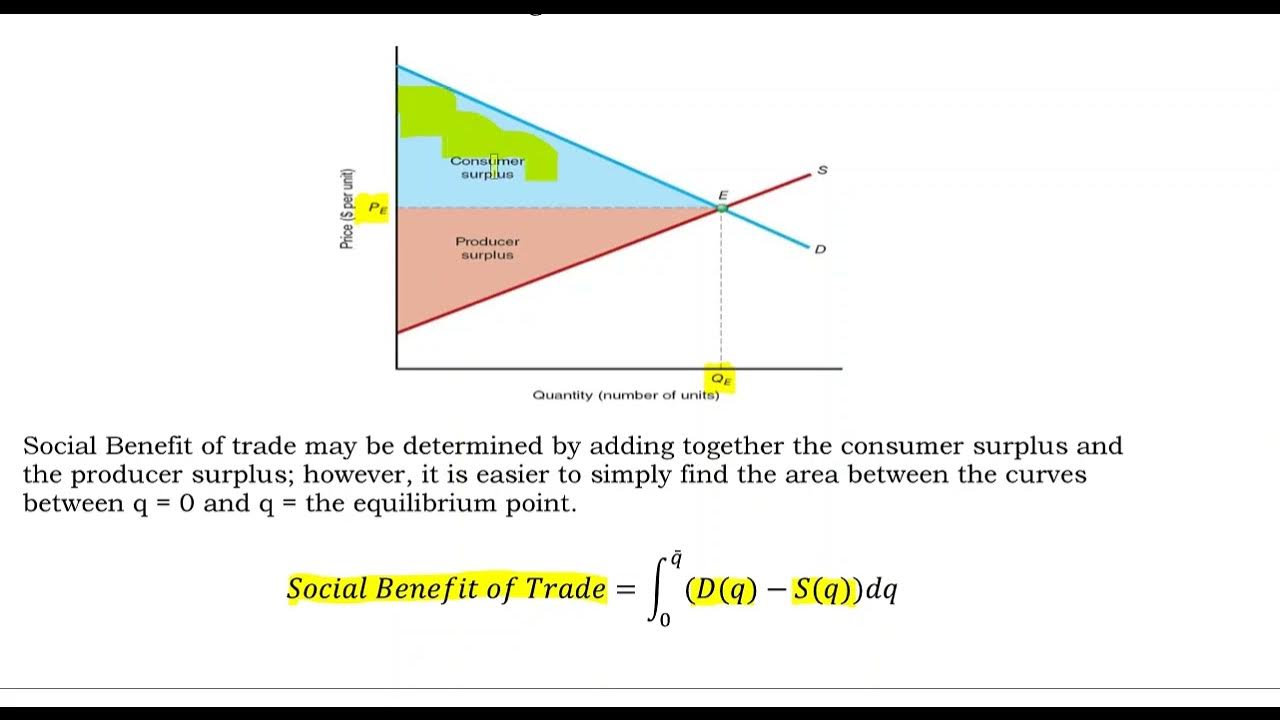
Social Benefit of Trade (Gains from Trade)
5.0 / 5 (0 votes)
Thanks for rating: