16. Compensating Variation and Equivalent Variation
TLDRThis video script explores the impact of price changes on consumer welfare through two key measures: compensating variation and equivalent variation. The compensating variation quantifies the income needed to restore a consumer's pre-price change utility, while the equivalent variation measures the income loss a consumer would accept to avoid the price change. Both concepts are illustrated using indifference curves and budget constraints, providing a practical framework for assessing consumer welfare and understanding the implications of market policies on individual well-being.
Takeaways
- 📈 Discusses measures of changes in welfare due to a price change.
- 📊 Illustrates the impact of a price change on initial and final utility.
- 🛒 Describes how individuals consume different bundles before and after a price increase.
- 📉 Explains how to decompose price changes into income and substitution effects.
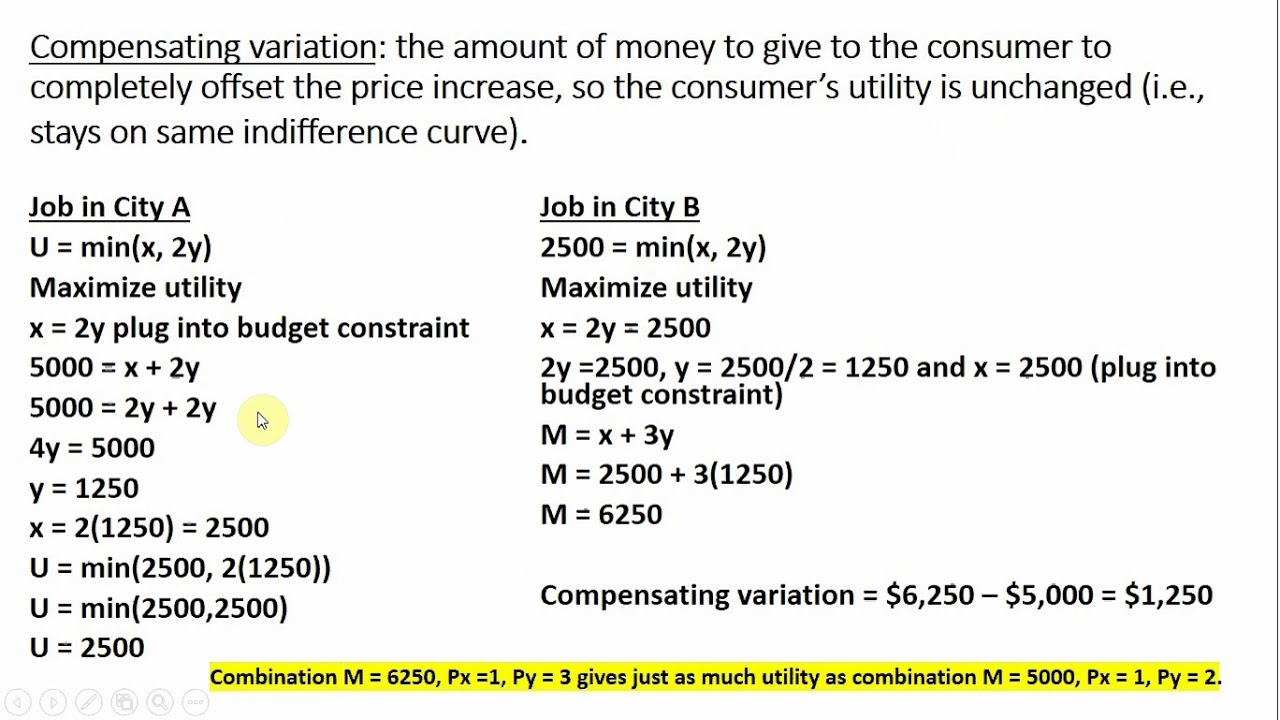
- 💰 Defines compensating variation as the amount of money needed to keep utility constant after a price change.
- 📏 Highlights that compensating variation is the difference in expenditures between two points.
- 💡 Introduces equivalent variation, measuring how much income an individual would give up to avoid a price change.
- 🔍 Compares compensating variation and equivalent variation as measures of welfare change.
- 📈 Emphasizes the practicality of measuring welfare changes in monetary terms rather than utility.
- 🏛️ Notes the importance of these measures in understanding the effects of policies and market dynamics on consumer welfare.
Q & A
What is the main topic discussed in the video?
-The main topic discussed in the video is the different measures of changes in welfare due to a price change.
What are the two types of welfare changes illustrated in the video?
-The two types of welfare changes illustrated are the income effect and the substitution effect.
How does the video describe the initial and final utility in the context of a price change?
-The video describes the initial utility as the original utility before the price change and the final utility as the utility after the price change, where the individual consumes a different bundle due to the price increase.
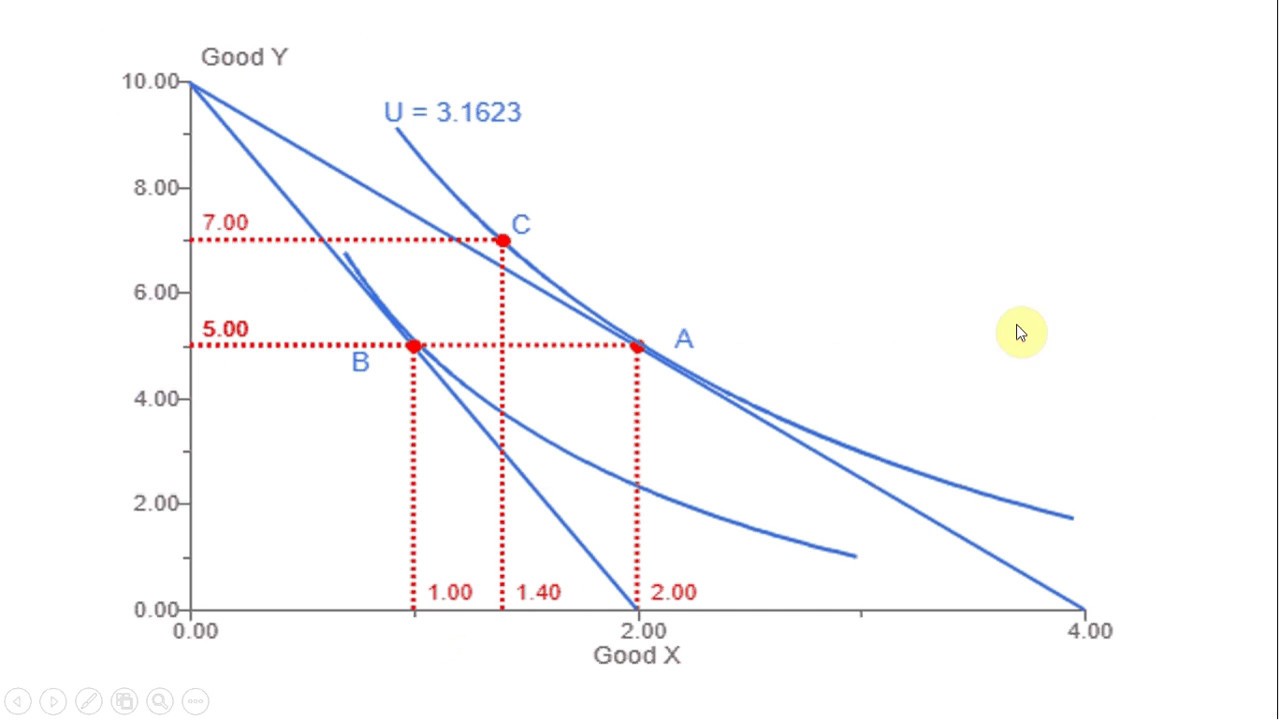
What is the purpose of finding a compensated point (point C) in the analysis?
-The purpose of finding a compensated point is to decompose the price change into income and substitution effects by finding a budget line that has the same slope as the new budget line but lies on the old indifference curve.
What is the compensating variation and how is it found on a graph?
-The compensating variation is the amount of money needed to make an individual feel as well off as before the price increase. It is found on the graph as the difference between the income on the original and compensated budget constraints.
How is the compensating variation related to the expenditure function?
-The compensating variation is the difference in the expenditure function at the original consumption bundle (A) and the compensated consumption bundle (C).
What is the equivalent variation and how does it differ from compensating variation?
-The equivalent variation is the amount of money the individual would be willing to give up to avoid the price change. It differs from compensating variation in that it is found on the new indifference curve and involves a different thought experiment regarding willingness to pay.
Why are the concepts of compensating and equivalent variation useful in economics?
-These concepts are useful because they provide measurable ways to represent how well off people are made by changes in prices, which helps in understanding the effects of policies and market conditions on consumer welfare.
Outlines
📈 Price Change and Welfare Measures
This paragraph discusses the impact of price changes on consumer welfare, introducing the concepts of utility and consumption bundles. The speaker explains how a price increase leads to a shift from bundle A to bundle B, and uses graphical illustrations to demonstrate two types of welfare changes: income effect and substitution effect. The compensated point 'C' is identified as a way to measure the substitution effect, and the compensating variation is calculated as the difference in income or expenditures between the original and compensated budget constraints. This approach provides a quantitative measure of welfare change, which is essential for understanding the economic implications of price fluctuations.
💰 Measuring Consumer Welfare with Compensating and Equivalent Variation
The second paragraph delves into the practical applications of compensating and equivalent variation as measures of consumer welfare. It emphasizes the importance of these measures in assessing how much money an individual would be willing to give up or receive to maintain their current level of utility in the face of price changes. The paragraph highlights the advantages of these measures over direct utility comparisons, as they are grounded in observable consumer behavior and monetary terms, making them more relevant for real-world policy analysis and market understanding. The equivalent variation is described as the amount an individual would pay to avoid a price increase, leading to a new budget constraint tangent to their indifference curve, which represents their willingness to pay for unchanged prices.
Mindmap
Keywords
💡Welfare
💡Price Change
💡Utility
💡Bundle
💡Income Effect
💡Substitution Effect
💡Compensated Point
💡Compensating Variation
Highlights
The video discusses different measures of changes in welfare due to a price change.
Illustrates the initial utility (uo) and final utility after the price change.
Explains the concept of compensated and uncompensated price changes.
Introduces the idea of decomposing price changes into income and substitution effects.
Demonstrates finding the compensated point (C) on the old indifference curve.
Discusses calculating compensating variation to measure welfare change.
Compensating variation is the difference in expenditures between points A and C.
Equivalent variation is another way to measure welfare change.
Equivalent variation asks how much the individual is willing to pay to avoid the price change.
Bundle E represents the point of equivalent variation on the new indifference curve.
Equivalent variation is found where the new budget constraint is tangent to the indifference curve.
Bundle E costs less than Bundle B, leading to a formula for equivalent variation.
Both compensating and equivalent variations are measured on indifference curves and budget constraints.
These measures provide a way to quantify consumer welfare changes in monetary terms.
They allow us to observe and measure changes in consumer well-being in the real world.
The measures are useful for understanding the effects of policies and market changes on consumer welfare.
The video concludes by emphasizing the importance of these measures in economics.
Transcripts
Browse More Related Video

How to Calculate Compensating Variation and Equivalent Variation
Perfect Substitutes Utility: Compensating Variation, Equivalent Variation, and Consumer Surplus
Three Measures of Consumer Welfare: Compensating Variation, Equivalent Variation, Consumer Surplus
Consumer Welfare: Compensating Variation & Equivalent Variation

(M4E8) [Microeconomics] Consumer Surplus: Compensating and Equivalence Variations
Mathematically Solving for the Income and Substitution Effect of a Price Change
5.0 / 5 (0 votes)
Thanks for rating: