AP Calculus AB: Lesson 2.4 The Second Derivative
TLDRThis lesson delves into the concept of the second derivative, illustrating its significance in analyzing a function's properties. The instructor explains how the sign of the first derivative indicates whether a function is increasing or decreasing, while the second derivative reveals the rate of change of the slope. The video demonstrates concavity, showing that a positive second derivative corresponds to a graph that is concave up, and a negative one to a graph that is concave down. Practical examples and graphical illustrations are used to clarify these concepts, providing students with tools to sketch the first and second derivative graphs from a given function.
Takeaways
- 📚 The lesson defines the second derivative and its role in analyzing the properties of functions.
- 🔍 The sign of the first derivative (f') indicates whether a function is increasing or decreasing; positive implies an increase, and negative implies a decrease.
- 📈 The magnitude of the slope of the tangent line (or the first derivative) indicates how rapidly a function is increasing or decreasing.
- 🔑 The second derivative (f'') represents the rate of change of the first derivative, essentially the slope of the slope.
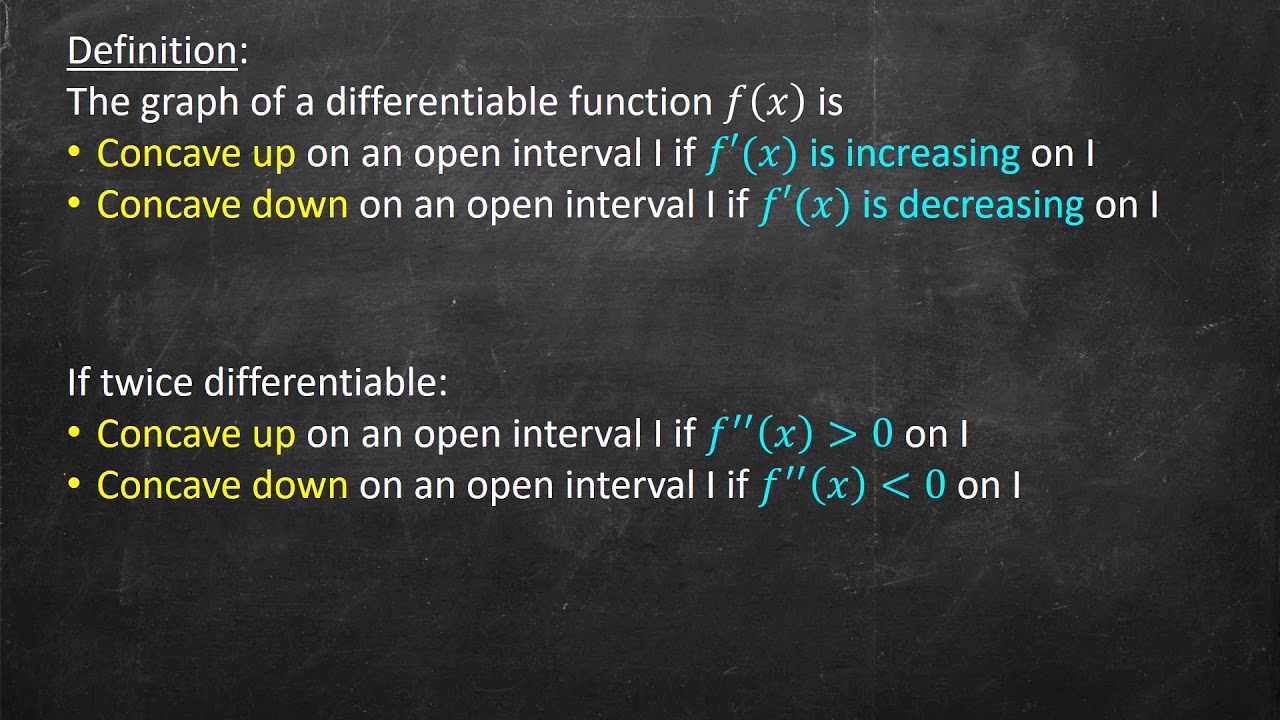
- 🤔 The concavity of a graph (whether it opens upward or downward) is related to the sign of the second derivative; concave up implies a positive second derivative, and concave down implies a negative one.
- 📉 At points where the first derivative is zero, the function has a horizontal tangent, which could indicate a local maximum or minimum.
- 📚 The lesson introduces different notations for derivatives, including Lagrange notation (f', f'', etc.) and Leibniz notation (dy/dx, d²y/dx², etc.).
- 🔄 The process of finding higher-order derivatives involves repeatedly applying the definition of the derivative to the current derivative function.
- 📈 The concept of concavity can be visually determined by the position of the tangent lines relative to the curve and can also be inferred from the sign of the second derivative.
- 📊 The sketching of the first and second derivative graphs is based on the slopes of the tangent lines at various points on the original function graph.
- 🔍 The lesson concludes with the idea that the second derivative is a crucial tool for understanding not just the direction of a function's change (increasing or decreasing), but also the rate at which that change is occurring.
Q & A
What is the second derivative?
-The second derivative is the derivative of the first derivative of a function. It measures the rate of change of the rate of change of the function, also known as the slope of the slope.
How does the sign of the first derivative (f') indicate the behavior of the function f?
-If the first derivative (f') is positive, the function f is increasing. If the first derivative is negative, the function f is decreasing.
What does the magnitude of the slope of the tangent line represent?
-The magnitude of the slope of the tangent line represents how rapidly the function is increasing or decreasing, without regard to whether it's positive or negative.
How is the second derivative related to the concavity of a function?
-If the second derivative is positive, the function is concave up, indicating that the rate of increase of the slope is itself increasing. If the second derivative is negative, the function is concave down, indicating that the rate of increase of the slope is decreasing.
What does it mean for a function to be differentiable on an interval?
-A function is differentiable on an interval if its derivative exists at every point within that interval, meaning the function has a well-defined slope at each point.
How can you determine if a function is increasing or decreasing at a specific point using the first derivative?
-At a specific point, if the first derivative (f') is positive, the function is increasing at that point. If the first derivative is negative, the function is decreasing at that point.
What is the connection between the concavity of a graph and the second derivative?
-A graph is concave up where the second derivative is positive, and concave down where the second derivative is negative. This connection helps in analyzing the curvature of the graph.
How can you use the second derivative to analyze the rate of increase or decrease of a function?
-A positive second derivative indicates that the function is increasing at an increasing rate, while a negative second derivative indicates that the function is decreasing at an increasing rate.
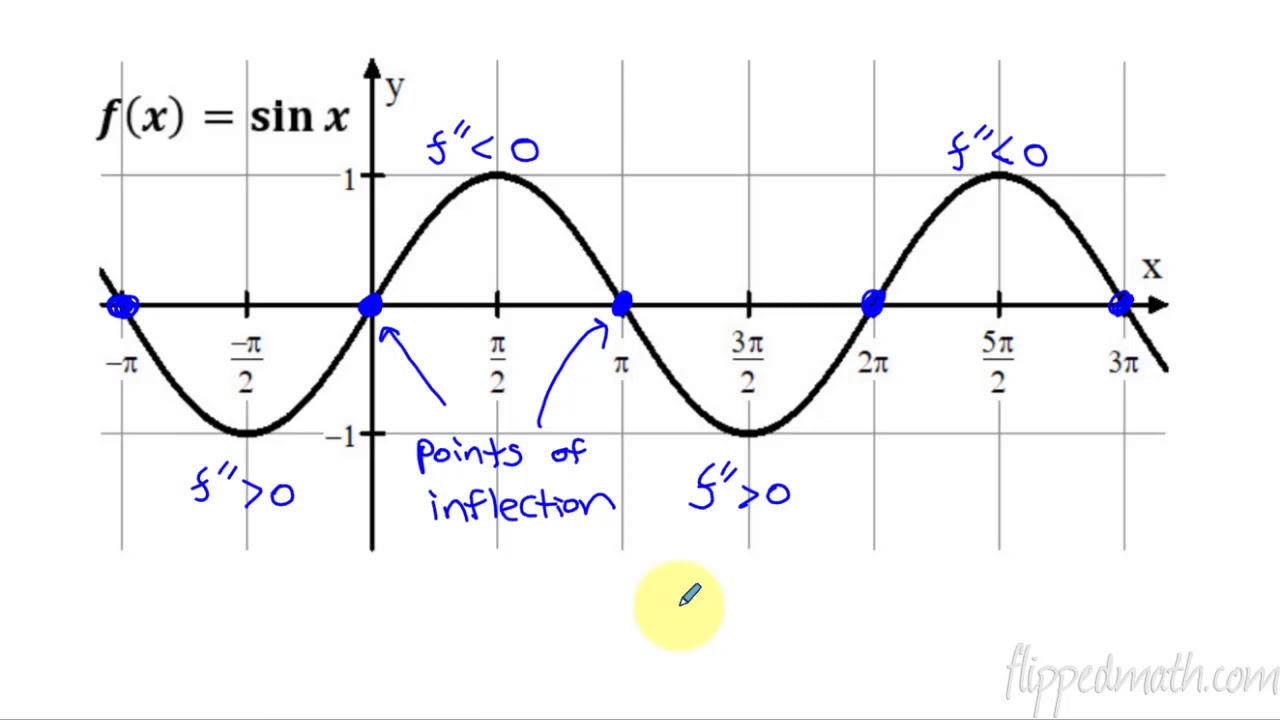
What is the significance of the second derivative in determining the inflection points of a function?
-The second derivative can help identify inflection points, where the concavity of the function changes. Inflection points occur where the second derivative is zero or changes sign.
How can you sketch the graph of the first and second derivatives from the graph of a function?
-By identifying key points such as where the slope is zero or changes sign, and using the properties of derivatives (e.g., a derivative of a polynomial of degree n results in a polynomial of degree n-1), you can sketch the graphs of the first and second derivatives.
What are the different notations used for derivatives?
-Common notations for derivatives include Lagrange notation (f', f'', etc.), Leibniz notation (dy/dx, d²y/dx², etc.), Euler's notation (with subscripts indicating the order of the derivative), and Newton's notation (with dots above the function symbol).
Outlines
📚 Introduction to Second Derivatives
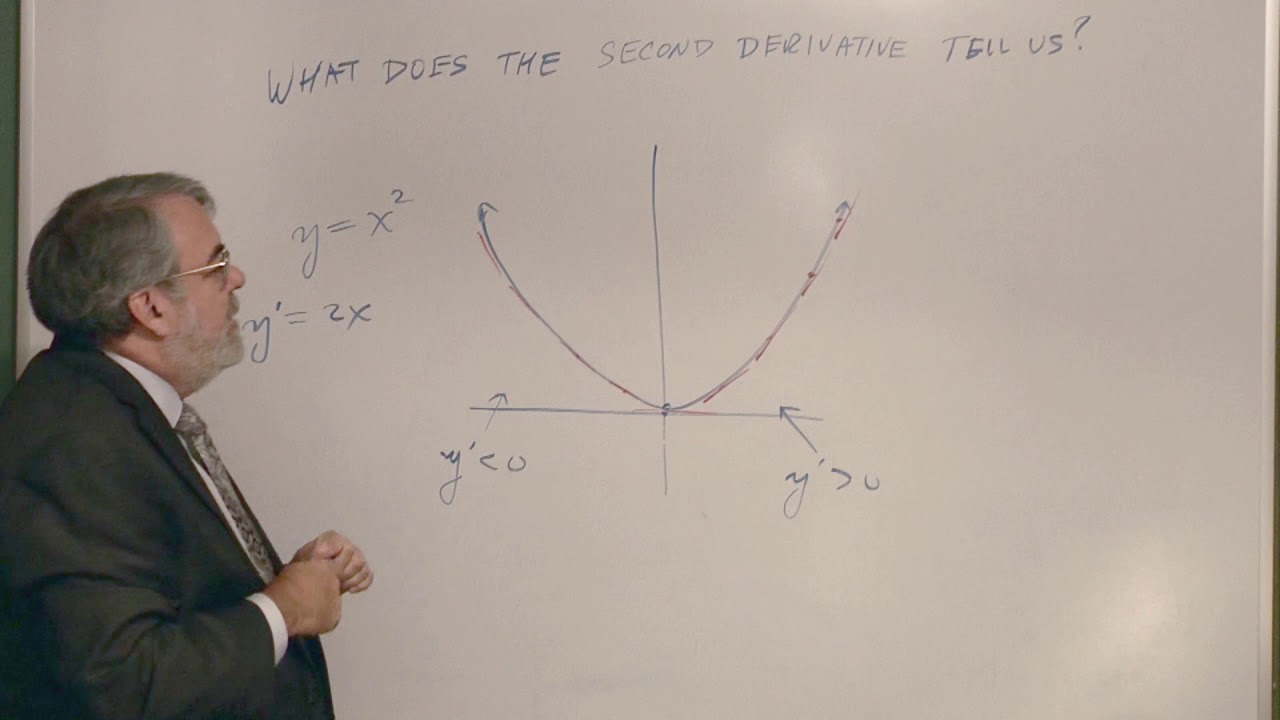
This paragraph introduces the concept of the second derivative, explaining its role in analyzing the properties of functions. It uses the graph of a function 'f' with labeled points and tangent lines to illustrate the relationship between the slope of the tangent line (f') and the function's behavior (increasing or decreasing). The importance of the sign of the slope is emphasized, as it indicates whether the function is increasing or decreasing. The magnitude of the slope is also discussed, showing how it reflects the rate of increase or decrease. The paragraph concludes with an explanation of the second derivative as the rate of change of the first derivative, which can be described in various ways such as 'slope of the slope' or 'derivative of the derivative'.
📈 Understanding the Significance of the First and Second Derivatives
The second paragraph delves deeper into the relationship between the first and second derivatives and the function's behavior. It establishes that a positive first derivative (f') indicates an increasing function over an interval, while a negative first derivative indicates a decreasing function. The paragraph also addresses the concept of open intervals and the ambiguity at endpoints, suggesting that the sign of the derivative at endpoints can help determine the function's behavior there. The summary includes an example with a graph of 'f(x)', identifying intervals where the function is increasing or decreasing based on the sign of the first derivative, and points where the first derivative is zero, indicating potential changes in the function's concavity.
🔍 Deriving the Second Derivative and Its Notations
This paragraph explains the process of deriving the second derivative, starting with the definition of the first derivative and then applying the same definition to the first derivative itself. It introduces the notation for the second derivative, including 'f'' for the second derivative of 'f', and discusses different notations such as Lagrange and Leibniz. The paragraph also touches on higher-order derivatives, explaining how they can be represented using additional prime symbols, roman numerals, or Arabic numerals. The process of deriving the second derivative is illustrated with an example, showing the transition from the first to the second derivative and the implications for the function's behavior.
🌌 Exploring Concavity and Its Relation to Derivatives
The fourth paragraph discusses concavity, which refers to the curvature of a graph, and its relation to the first and second derivatives. It explains that a graph can be concave up (like an upside-down parabola) or concave down (like a regular parabola), or neither if it's a linear function. The paragraph uses graphs to illustrate how the rate of increase or decrease of a function can be inferred from its concavity. It also explains that a function increasing at an increasing rate is concave up, while a function increasing at a decreasing rate is concave down. The connection between the concavity and the second derivative is established, with the second derivative's sign indicating the direction of concavity.
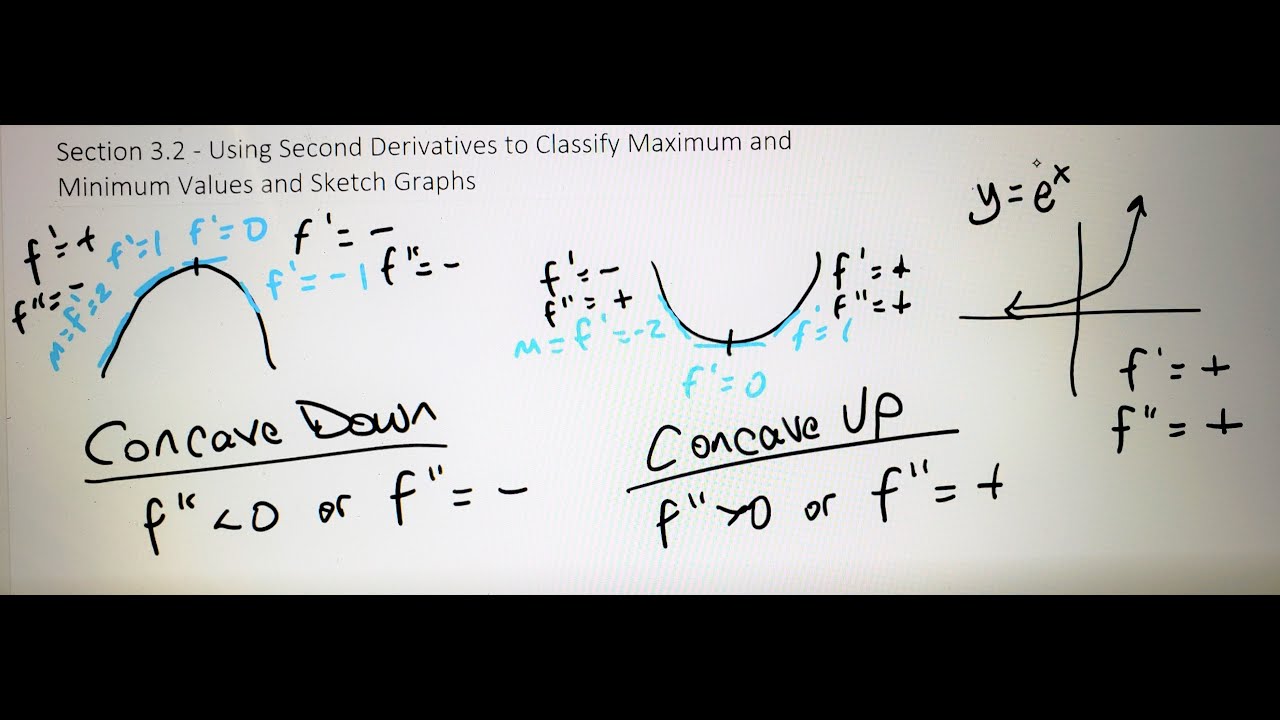
📉 Analyzing the Connection Between Tangent Lines and Concavity
In this paragraph, the relationship between the position of tangent lines relative to the curve and the concavity of the function is explored. It demonstrates that for a concave up function, all tangent lines lie below the curve, and as one moves from left to right, the slopes of these tangent lines increase, indicating a positive second derivative. Conversely, for a concave down function, the tangent lines lie above the curve, and their slopes decrease, indicating a negative second derivative. The paragraph uses graphical examples to show how the slopes of the tangent lines can be estimated and how this relates to the function's concavity and the sign of the second derivative.
🤔 Determining Concavity Changes Using Tangent and Secant Lines
The sixth paragraph provides methods for determining changes in concavity, such as using tangent and secant lines. It explains that if a tangent line is below the curve, the function is concave up, and if it's above the curve, the function is concave down. The paragraph also suggests using a secant line through two points on either side of the point in question to help determine concavity. If the secant line is below the curve, the function is concave down, and vice versa. The importance of recognizing when a graph is concave up or down, especially when the curvature is subtle, is emphasized.
📚 Sketching Derivatives from a Function Graph
The seventh paragraph demonstrates how to sketch the graphs of the first and second derivatives, 'f'' and 'f''', from the graph of a function 'f'. It identifies key points where the slope of 'f' is zero and uses these to plot points on the 'f'' graph. The paragraph also discusses the symmetry of the derivative graph for a polynomial function and uses this to estimate additional points for the 'f'' graph. Finally, it explains how to determine the 'f''' graph by considering the slopes of the tangent lines to the 'f'' graph, which should form a straight line if 'f' is a quadratic function.
👋 Conclusion and Preview of Future Topics
The final paragraph concludes the lesson on second derivatives and provides a preview of upcoming topics, which include continuity and differentiability. It summarizes the key points covered in the lesson, including the relationship between the second derivative, the function's concavity, and the behavior of the function, such as increasing or decreasing. The paragraph thanks the viewers for joining the lesson and sets expectations for the next session.
Mindmap
Keywords
💡Second Derivative
💡Tangent Line
💡Slope
💡Increasing Function
💡Decreasing Function
💡Concavity
💡Rate of Change
💡Derivative
💡Differentiable
💡Interval
💡Magnitude of Slope
Highlights
Definition of the second derivative and its role in analyzing function properties.
The relationship between the sign of the first derivative and the increasing or decreasing nature of a function.
The concept that the magnitude of the slope indicates how rapidly a function is increasing or decreasing.
The second derivative as the rate of change of the first derivative, indicating how quickly the slope is changing.
Different notations for the second derivative, including Lagrange and Leibniz notations.
Concavity as it relates to the curvature of a graph, distinguishing between concave up, concave down, and linear functions.
The connection between the rate of increase or decrease of a function and its concavity.
How the second derivative can be used to determine the concavity of a graph, with positive indicating concave up and negative indicating concave down.
The method of using tangent lines to estimate the slopes of a graph and infer the behavior of the function's derivative.
The importance of the second derivative in determining whether a function's slope is increasing or decreasing.
The process of sketching the graph of the first and second derivatives from the original function's graph.
The significance of the second derivative in understanding the curvature and behavior of a function at different points.
The practical application of second derivatives in analyzing the steepness and direction of change in functions.
The graphical representation of the first and second derivatives and their implications for the original function's behavior.
How the second derivative can be used to identify points of inflection where the concavity of a graph changes.
The conclusion that the second derivative is a critical tool in the analysis of functions, providing insights into increasing/decreasing behavior and concavity.
Transcripts
Browse More Related Video
Concavity and the 2nd Derivative Test
Math 11 - Section 3.2
Concavity introduction | Using derivatives to analyze functions | AP Calculus AB | Khan Academy
Calculus AB/BC – 5.6 Determining Concavity of Functions over Their Domains
What the Second Derivative Tells Us

MATH1325 Lecture 10 2 - Concavity & Points of Inflection
5.0 / 5 (0 votes)
Thanks for rating: