Concavity and the 2nd Derivative Test
TLDRThe video script delves into the relationship between the second derivative and the behavior of function graphs. It explains how the second derivative can be used to classify critical points as either maxima or minima. The presenter illustrates that at a minimum, the slope of the tangent lines increases as one moves away from the point, indicating a positive second derivative, which is associated with a concave up graph. Conversely, at a maximum, the slope decreases, leading to a negative second derivative and a concave down graph. The concept of concavity and its connection to the sign of the second derivative is established. The script also introduces the second derivative test to determine the nature of critical points, explaining that a positive second derivative at a critical point indicates a local minimum, while a negative second derivative indicates a local maximum. The test fails when the second derivative is zero, necessitating further analysis. An example using the function f(x) = x^3 - 3x + 3 is provided to demonstrate the application of the second derivative test and to sketch the function's graph based on the concavity information.
Takeaways
- 📈 The second derivative of a function can be used to determine the concavity of a graph and classify critical points as maxima or minima.
- 🔍 A horizontal tangent line at a minimum point indicates the start of an increasing slope as you move away from the minimum.
- ➡️ As you move to the right from a minimum point, the slope of the tangent lines increases, indicating a positive first derivative.
- 🔽 Conversely, approaching a minimum from the left involves a negative slope that becomes less negative, also indicating an increasing first derivative.
- 📌 At a maximum point, the slope starts large, decreases through zero at the maximum, and then becomes increasingly negative, indicating a decreasing first derivative.
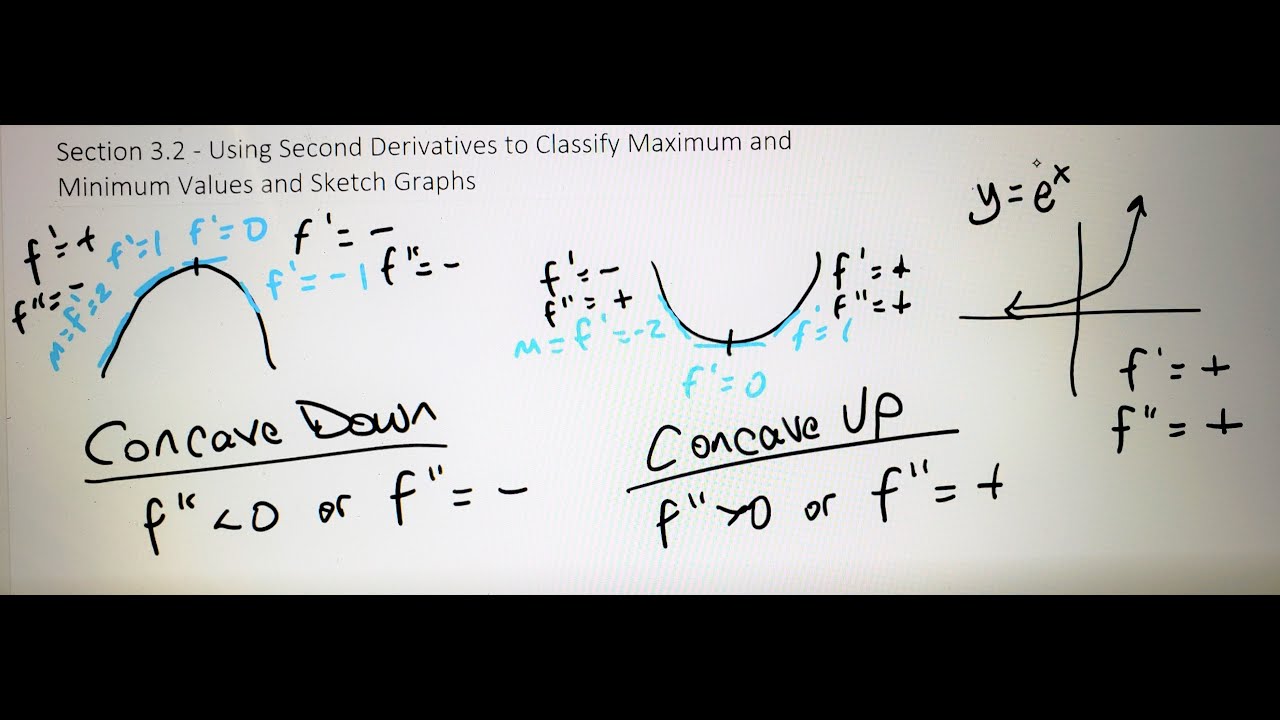
- 😀 A graph that is concave up has increasing slopes of tangent lines, which corresponds to a positive second derivative.
- 😞 A graph that is concave down has decreasing slopes of tangent lines, corresponding to a negative second derivative.
- 🔄 An inflection point occurs where the concavity changes, which can happen when the second derivative is zero or does not exist.
- 🔢 The second derivative test involves finding critical points (where the first derivative is zero) and then analyzing the second derivative to determine if they are maxima or minima.
- ⛰️ If the second derivative is positive at a critical point, it indicates a local minimum; if negative, it indicates a local maximum.
- ⚠️ If the second derivative is zero, further analysis is required as it does not provide enough information to classify the critical point.
- 📊 An example function f(x) = x^3 - 3x + 3 is used to illustrate the process of finding critical points and using the second derivative to determine the nature of these points.
Q & A
How does the second derivative relate to the graph of a function?
-The second derivative provides information about the concavity of the graph, which can be used to classify critical points as maximums or minimums. A positive second derivative indicates concave up (like a smiley face), while a negative second derivative indicates concave down (like a sad face).
What happens to the slope of the tangent line as you move away from a minimum point on a graph?
-As you move away from a minimum point, the slope of the tangent line increases. If you move to the right, the slope becomes more positive, and if you move to the left, the slope becomes less negative (increasing towards zero).
What is the relationship between the first derivative and the concavity of a graph?
-If the first derivative is increasing, it is equivalent to the graph being concave up. Conversely, if the first derivative is decreasing, the graph is concave down.
What is an inflection point, and how does it relate to the second derivative?
-An inflection point is a point on the graph where the concavity changes. It can occur when the second derivative is zero and the sign changes from negative to positive or vice versa, or when the second derivative does not exist, such as at a vertical tangent.
How does the second derivative test help in determining whether a critical point is a maximum or a minimum?
-The second derivative test involves finding the critical points where the first derivative is zero and then analyzing the second derivative at those points. If the second derivative is positive, the point is a local minimum; if it's negative, the point is a local maximum. If the second derivative is zero, further analysis is needed.
What are the limitations of the second derivative test?
-The second derivative test fails when the second derivative is zero because it does not provide information on whether the point is a maximum, minimum, or neither. Additional analysis is required in such cases.
How can you determine if a point is an inflection point without using the second derivative?
-An inflection point can be identified by a change in the concavity of the graph without the need for the second derivative. This can be observed visually or by noting a change in the sign of the first derivative from increasing to decreasing or vice versa.
What is the first step in applying the second derivative test to a function?
-The first step is to find the critical points of the function, which are the points where the first derivative (f'(x)) is equal to zero.
What is the mathematical expression for concave up and concave down in terms of the second derivative?
-A graph is concave up if the second derivative (f''(x)) is positive over an interval, and concave down if the second derivative is negative over an interval.
How does the sign of the second derivative at a critical point indicate the nature of that point?
-If the second derivative at a critical point is positive, the point is a local minimum. If the second derivative is negative, the point is a local maximum.
Can the second derivative test be applied to functions that are not differentiable at a point?
-No, the second derivative test requires the existence of both the first and second derivatives at the point in question. If the function is not differentiable at a point, the test cannot be applied there.
What is the role of the first derivative in identifying critical points?
-The first derivative, f'(x), indicates the slope of the tangent line to the graph of the function at a given point. Critical points occur where the first derivative is zero or undefined, and these points are potential locations for local maxima, local minima, or inflection points.
Outlines
📈 Understanding Second Derivatives and Function Graphs
This paragraph explains the relationship between the second derivative and the graph of a function. It discusses how the second derivative can be used to classify critical points as maxima or minima. The video uses the concept of a horizontal tangent line at a minimum point and how the slope of the tangent lines changes as one moves away from this point to illustrate the increasing nature of the first derivative (f prime of X) when moving to the right and the decreasing nature when moving to the left. The same logic is applied to a maximum point, where the slope decreases as one moves from either side towards the maximum. The paragraph introduces the concepts of concavity, defining concave up as when the first derivative is increasing (equivalent to a positive second derivative) and concave down as when the first derivative is decreasing (equivalent to a negative second derivative). It also touches on the idea of an inflection point, where the concavity changes, which can occur when the second derivative is zero or does not exist, as in the case of a vertical tangent.
📉 The Second Derivative Test for Maxima and Minima
The second paragraph delves into the second derivative test, which is used to analyze whether a critical point is a maximum or minimum. It starts by defining critical points as locations where the first derivative is zero. For a maximum, the graph is concave down, indicated by a negative second derivative, while for a minimum, the graph is concave up, indicated by a positive second derivative. If the second derivative is zero, the test is inconclusive, and further analysis is required. An example is provided with the function f(X) = X^3 - 3X + 3, where the first derivative is set to zero to find critical points at X = ±1. The second derivative, F double prime of X, equals 6X, which is used to determine the concavity at these points. The results show an inflection point at X = 0, a minimum at X = 1, and a maximum at X = -1. The paragraph concludes with a method to sketch the function's graph by analyzing the concavity and the second derivative, allowing the identification of maxima and minima.
Mindmap
Keywords
💡Second derivative
💡Critical points
💡Concavity
💡Tangent line
💡
💡Inflection point
💡Second derivative test
💡Derivative
💡Cubic function
💡Local maximum/minimum
💡Graph sketching
💡Slope
Highlights
The second derivative is used to analyze the concavity of a function's graph and classify critical points as maxima or minima.
A minimum point with a horizontal tangent line has increasing slopes as one moves away from the point on either side.
As one approaches a minimum from the left, the slope of the tangent line increases from negative to less negative.
Concave up graphs are associated with increasing slopes of tangent lines, analogous to a 'smiley face'.
Concave down graphs have decreasing slopes of tangent lines, likened to a 'sad face'.
The first derivative increasing is equivalent to the second derivative being positive, indicating concave up.
The first derivative decreasing is equivalent to the second derivative being negative, indicating concave down.
An inflection point is where the concavity changes, which can occur when the second derivative is zero or does not exist.
The second derivative test involves finding critical points where the first derivative is zero and then analyzing the concavity at those points.
If the second derivative is less than zero at a critical point, it indicates a local maximum.
A positive second derivative at a critical point indicates a local minimum.
If the second derivative equals zero, further analysis is required as it does not definitively indicate a maximum or minimum.
The function f(x) = x^3 - 3x + 3 is used as an example to demonstrate the second derivative test.
The first derivative f'(x) = 3x^2 - 3 is found, and setting it to zero gives the critical points x = ±1.
The second derivative f''(x) = 6x is computed to determine the concavity at the critical points.
At x = 1, the graph is concave up, indicating a minimum, while at x = -1, it is concave down, indicating a maximum.
The second derivative test can fail to identify a minimum when the second derivative is zero, as seen in the example of x^4.
A rough sketch of the cubic function can be plotted by analyzing the second derivative to determine regions of concavity.
Transcripts
Browse More Related Video
Concavity introduction | Using derivatives to analyze functions | AP Calculus AB | Khan Academy

Second Derivative Test to find relative maximums and minimums (extrema)

MATH1325 Lecture 10 2 - Concavity & Points of Inflection
Math 11 - Section 3.2
Calculus 1: Concavity Examples

Second derivative test | Using derivatives to analyze functions | AP Calculus AB | Khan Academy
5.0 / 5 (0 votes)
Thanks for rating: