Concavity introduction | Using derivatives to analyze functions | AP Calculus AB | Khan Academy
TLDRThis script discusses the identification of local maximum and minimum points on a function's graph using derivatives and concavity. It explains that critical points, where the derivative is zero or undefined, are potential maximum or minimum points. By analyzing the sign of the first and second derivatives, one can determine if a function is concave up or down, which aids in identifying minima and maxima. A negative second derivative indicates a concave down interval, leading to a maximum point, while a positive second derivative indicates a concave up interval, leading to a minimum point.
Takeaways
- 📈 The graph of y equals f(x) represents the original function.
- 📌 The derivative f'(x) helps identify where the function has a slope of zero, which are potential critical points for local maximum or minimum.
- 🔄 By analyzing the sign change of the derivative around critical points, we can determine if they are local maximum or minimum points.
- 📉 A function is at a local maximum where the derivative changes from positive to negative.
- 📈 A function is at a local minimum where the derivative changes from negative to positive.
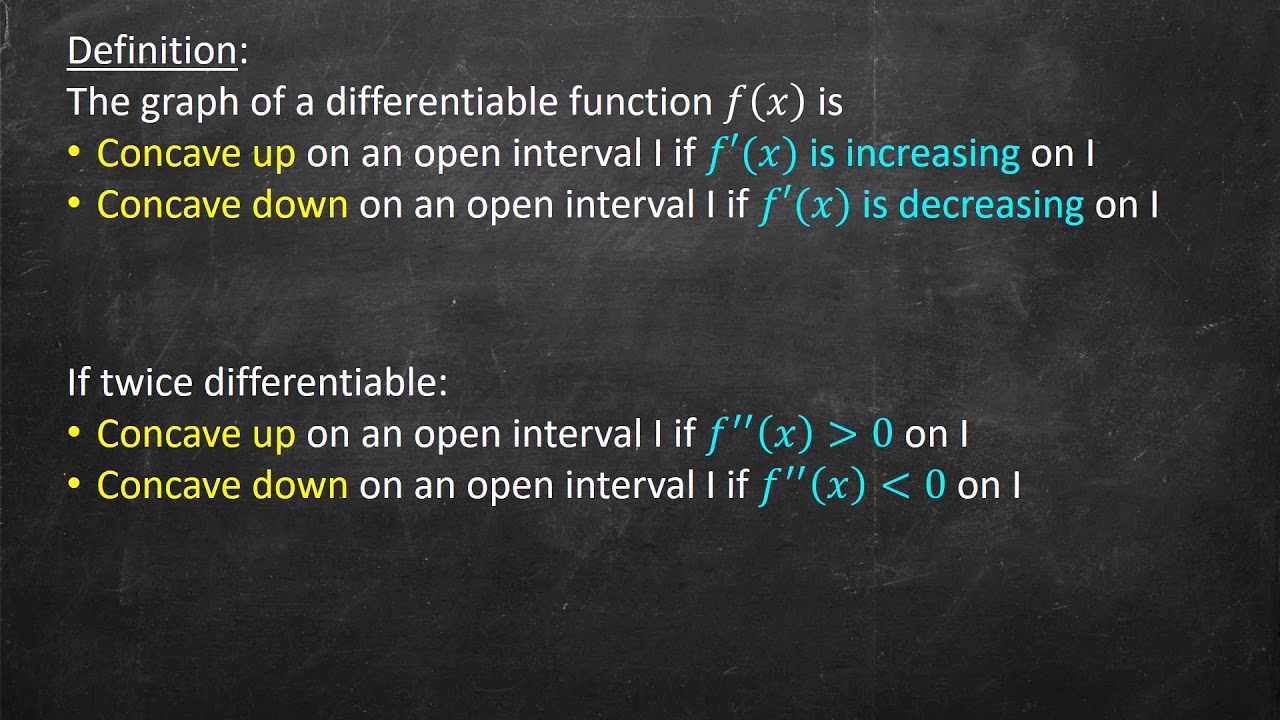
- 🔄 The concept of concavity, or the shape of the graph's curvature, can be used to further analyze critical points.
- 📊 The second derivative f''(x) indicates the rate of change of the first derivative, providing insight into the concavity.
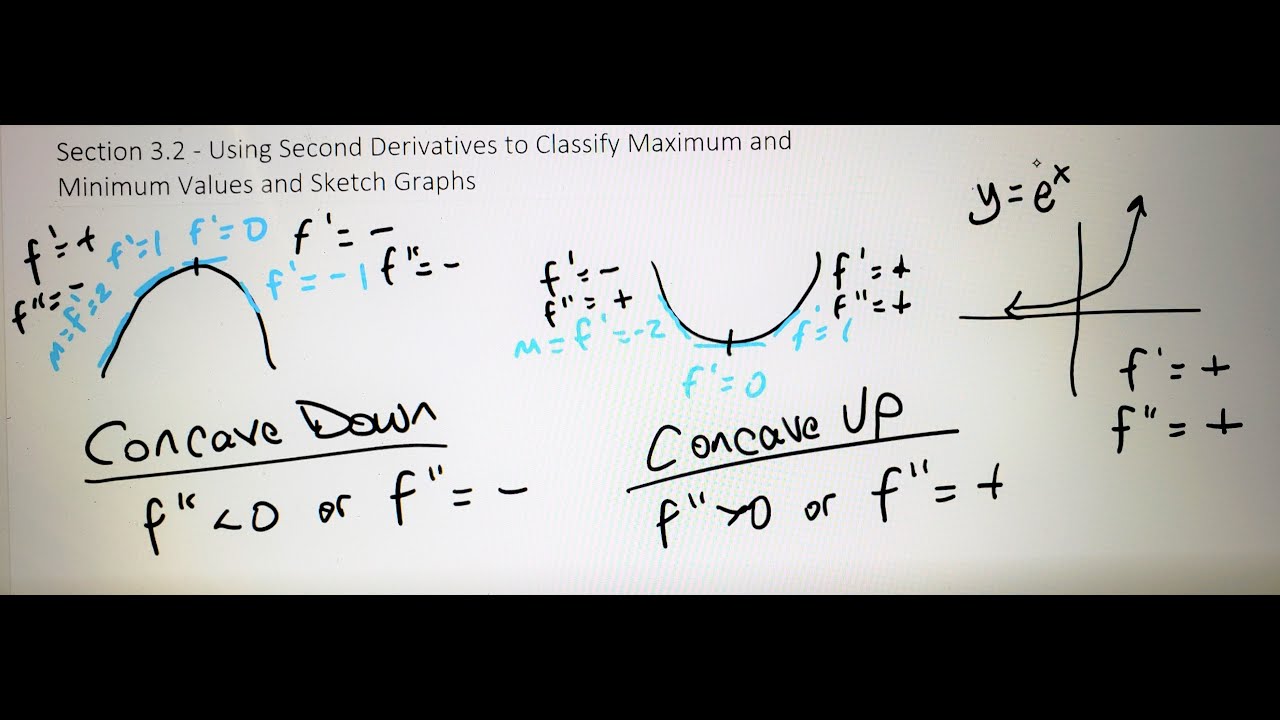
- 📈 If the second derivative is negative, the function is concave down (shaped like an upside-down U).
- 📊 If the second derivative is positive, the function is concave up (shaped like an upward-facing U).
- 🔑 A critical point where the function is concave down and the first derivative is zero indicates a local maximum.
- 🔑 A critical point where the function is concave up and the second derivative is positive indicates a local minimum.
Q & A
What colors are used to represent the original function, its first derivative, and its second derivative?
-The original function is represented in yellow, its first derivative (f prime of x) in mauve, and its second derivative in blue.
How can critical points of a function be identified?
-Critical points can be identified where the function's derivative is either undefined or equal to 0.
What does it indicate when the derivative of a function changes from positive to negative at a point?
-When the derivative changes from positive to negative at a point, it indicates that the function is at a local maximum point there, since it was increasing before the point and decreases after.
What is indicated by a derivative that changes from negative to positive at a certain point?
-A derivative changing from negative to positive at a certain point indicates a local minimum for the function, as it shows the function was decreasing before the point and increases after.
What does concavity indicate about the function's rate of change?
-Concavity indicates the direction and rate of change in the function's slope. A concave downwards interval indicates the slope is decreasing (second derivative is negative), and a concave upwards interval indicates the slope is increasing (second derivative is positive).
How can you determine if a function is concave upwards or downwards?
-A function is concave downwards if its second derivative is negative across an interval, indicating decreasing slope. It is concave upwards if its second derivative is positive, indicating increasing slope.
What role does the second derivative play in identifying the nature of a critical point?
-The second derivative helps identify whether a critical point (where the first derivative is 0) is a maximum or a minimum. If the second derivative is negative, the point is a maximum; if positive, the point is a minimum.
What is the significance of a zero slope at a critical point in the context of concavity?
-A zero slope at a critical point, in the context of concavity, signifies that the function's rate of change is momentarily static at the maximum or minimum point, depending on the concavity of the function around that point.
Can a function have a critical point where the derivative is undefined? What would this imply?
-Yes, a function can have a critical point where the derivative is undefined, implying a potential cusp or discontinuity in the function at that point, which could also be a maximum or minimum.
How does the transition in the sign of the second derivative affect the shape of the function?
-The transition in the sign of the second derivative affects the function's shape by indicating a change in concavity. A transition from negative to positive signifies a move from a concave downwards to a concave upwards shape, affecting the nature of extremas around critical points.
Outlines
📈 Understanding Critical Points and Derivatives
This paragraph introduces the concept of critical points in a function by examining the graph of a function, its first derivative, and its second derivative. The speaker explains how to identify local maximum and minimum points by observing the function's behavior and its derivatives. Critical points are defined as points where the derivative is either zero or undefined. The speaker also discusses how the sign of the first derivative can help determine if a function is increasing or decreasing, and how the concavity of a function can be used to further analyze these critical points. The main points include the identification of critical points, the relationship between the first and second derivatives, and the use of concavity to understand the function's behavior.
📊 Analyzing Concavity to Determine Extreme Points
The second paragraph delves deeper into the concept of concavity and its role in determining whether a critical point is a minimum or maximum. The speaker explains the difference between concave downwards (where the second derivative is negative) and concave upwards (where the second derivative is positive). By examining the intervals where the derivative is decreasing or increasing, one can identify concave intervals. The speaker then relates these intervals to the original function's behavior at its critical points. If a critical point is concave downwards with the first derivative being zero, it is a maximum point. Conversely, if a critical point is concave upwards with a positive second derivative, it is a minimum point. The summary emphasizes the importance of concavity in analyzing the nature of extreme points and the practical application of derivatives in understanding a function's behavior.
Mindmap
Keywords
💡Derivative
💡Critical Points
💡Local Maximum/Minimum
💡Concavity
💡Second Derivative
💡Slope
💡Maximum Point
💡Minimum Point
💡Positive/Negative Slope
💡Interval
Highlights
The graph of y equals f(x) is represented in yellow.
The derivative of f(x), denoted as f'(x), is graphed in mauve.
The second derivative, denoted as f''(x), is graphed in blue.
Local maximum and minimum points can be identified by observing the graph.
Critical points are where the derivative is either zero or undefined.
The behavior of the derivative around a critical point can indicate if it's a maximum or minimum.
A function increasing to a critical point and decreasing after indicates a local maximum.
A function decreasing to a critical point and increasing after indicates a local minimum.
The concept of concavity is introduced to further analyze the function's behavior.
Concavity can be determined by examining the second derivative.
A downward opening U shape indicates concavity downwards.
An upward opening U shape indicates concavity upwards.
A negative second derivative indicates a concave downwards interval.
A positive second derivative indicates a concave upwards interval.
A critical point with concavity downwards and f'(a)=0 is a maximum point.
A critical point with concavity upwards and f''(a)>0 is a minimum point.
Transcripts
Browse More Related Video


5.0 / 5 (0 votes)
Thanks for rating: