High School Physics: Graphing Motion
TLDRThis script delves into the concepts of graphing motion, focusing on the construction and interpretation of position, velocity, and acceleration graphs. It explains how particle diagrams, also known as dot diagrams, can reveal information about an object's motion, such as constant velocity or acceleration. The video also explores how the slope of position-time graphs equals velocity, and the area under the velocity-time graph represents distance traveled. It further illustrates how the area under an acceleration-time graph indicates a change in velocity. The script concludes with a practical exercise, encouraging viewers to analyze and graph their own movements, fostering a deeper understanding of the principles discussed.
Takeaways
- 📊 Understanding Graphs: The discussion focuses on constructing and interpreting graphs for position, velocity, and acceleration, using slopes and areas for calculations and interpretations.
- 🚗 Particle Diagrams: Also known as dot or ticker-tape diagrams, these represent motion through patterns that can indicate constant velocity or acceleration, but not the direction of motion.
- 🏃♂️ Constant Velocity: If a car leaks oil at equal intervals and the oil drops are evenly spaced, it indicates constant velocity.
- 🌟 Acceleration: If a car accelerates, the oil drops will be closer together at the start, spreading apart over time as speed increases.
- 📈 Position-Time Graph: A graph showing an object's position as a function of time, where the slope of the graph represents velocity.
- 🐶 Dog's Motion: An example of a dog's movement, starting from rest, moving at a constant speed, pausing, and then returning to the starting point at a higher speed, illustrates how position changes over time.
- 🔽 Zero Velocity: A horizontal section in the position-time graph indicates zero velocity, as seen when the dog takes a rest.
- 🔽 Negative Slope: A negative slope in the position-time graph indicates the object is moving in the opposite direction, as when the dog returns to the starting point.
- 🏎️ Velocity-Time Graph: Derived from the position-time graph, it shows an object's velocity as a function of time, and the area under the curve represents displacement.
- ⏱️ Time and Distance: The total distance traveled by an object can be calculated by the area under the velocity-time graph, considering shapes like triangles and rectangles.
- 📉 Acceleration: The slope of a velocity-time graph indicates acceleration, and a horizontal line signifies zero acceleration at that point.
Q & A
What is the purpose of a particle diagram in understanding motion?
-A particle diagram, also known as a dot or ticker-tape diagram, helps visualize the motion of an object by representing it through a series of points or 'dots' at regular intervals. It allows us to analyze whether the object is moving at a constant velocity, accelerating, or decelerating by observing the pattern and spacing of these dots.
How can you determine if a car is moving at a constant velocity from an oil leak pattern?
-If the oil leak pattern shows that the oil drops are consistently the same distance apart, it indicates that the car is moving at a constant velocity. The uniform spacing suggests a steady, unchanging speed.
What does a non-uniform particle diagram indicate about the motion of the object?
-A non-uniform particle diagram, where the spacing between the dots changes, indicates that the object is accelerating. If the dots are closer together at the beginning and get progressively farther apart, the object is accelerating. Conversely, if the dots start farther apart and move closer together, the object is decelerating.
How can you tell if an object has a negative velocity and negative acceleration, and is speeding up?
-If an object has a negative velocity (moving to the left) and also has a negative acceleration (accelerating to the left), the velocity and acceleration vectors are in the same direction. This means the object is speeding up in the negative direction, becoming more negative in velocity.
What does the slope of a position-time graph represent?
-The slope of a position-time graph represents the velocity of the object. The steeper the slope, the higher the velocity, and a horizontal line with a slope of zero indicates a velocity of zero, as the object is not changing position over time.
How can you calculate the position change of an object using a velocity-time graph?
-The position change of an object can be calculated by determining the area under the velocity-time graph. This area represents the total distance traveled by the object during the time interval, taking into account both the magnitude and direction of the velocity.
What is the relationship between the slope of a velocity-time graph and acceleration?
-The slope of a velocity-time graph is directly related to acceleration. A positive slope indicates acceleration, while a negative slope indicates deceleration. A horizontal line with a slope of zero indicates that the acceleration is zero, as the velocity is not changing over time.
How can you determine the total distance traveled by an object using an acceleration-time graph?
-The total distance traveled by an object can be determined by calculating the area between the acceleration-time graph and the time axis over the entire time interval. This area represents the change in velocity, and when combined with the direction of the velocity, it gives the total distance covered.
What type of graph would represent an object moving with uniform acceleration down an inclined plane?
-An object moving with uniform acceleration down an inclined plane would be represented by a parabolic shape in the position-time graph. This is because the velocity-time graph would be a straight line with a constant positive slope, indicating constant acceleration, and the position-time graph would reflect this by starting with a zero slope and increasing to a larger slope as time progresses.
How can practicing graphing your own motion help in understanding graphing concepts?
-Practicing graphing your own motion, such as walking back and forth in a straight line for 15 seconds, can help solidify your understanding of graphing concepts by allowing you to visualize and create position-time, velocity-time, and acceleration-time graphs based on your own movements. This hands-on experience can make abstract concepts more tangible and easier to grasp.
Why is it important to measure the area under a graph to the zero point?
-Measuring the area under a graph to the zero point is important because it accounts for the direction of the motion as well as the magnitude. This is particularly relevant when calculating distances or changes in velocity, as the area under the graph can be positive or negative, indicating the direction of motion or the direction of the velocity change.
Outlines
🚗 Understanding Particle Motion through Graphs
This paragraph introduces the concept of graphing motion, specifically focusing on particle diagrams, also known as dot diagrams or ticker-tape diagrams. It uses the analogy of an oil leak from a car to explain how these diagrams can reveal information about an object's motion, such as constant velocity or acceleration. The paragraph discusses how the spacing of the oil drops can indicate whether the car was moving at a constant speed or accelerating, and how the direction of velocity and acceleration can differ, as in the case of a car speeding up while moving in the opposite direction.
📈 Interpreting Position-Time and Velocity-Time Graphs
The second paragraph delves into the interpretation of position-time and velocity-time graphs. It uses the example of a dog's movement to illustrate how these graphs can represent an object's position and velocity as functions of time. The paragraph explains how the slope of the position-time graph represents velocity, and how the area under the velocity-time graph corresponds to the object's position change. It also demonstrates how to derive the velocity-time graph from the position-time graph and vice versa, emphasizing the importance of measuring areas accurately to the zero point.
🏎️ Analyzing Acceleration and Distance Traveled
This paragraph focuses on the analysis of acceleration and the total distance traveled by an object. It explains how the slope of a velocity-time graph can be used to determine acceleration and how the area under the graph can reveal the object's change in velocity. The paragraph also discusses the method of breaking complex areas under a graph into simpler shapes for easier calculation. Using the example of a car traveling during a six-second interval, the paragraph shows how to calculate the total distance traveled by summing the areas of different geometric shapes formed under the graph.
📊 Identifying Uniform Acceleration in Graphs
The final paragraph discusses the identification of uniform acceleration through acceleration-time graphs and how to derive velocity-time and position-time graphs from it. It emphasizes the need for a constant value in the acceleration-time graph to represent uniform acceleration and explains that a straight line with a positive slope in the velocity-time graph would correspond to this condition. The paragraph concludes with a practical exercise, encouraging the audience to physically walk in different motion patterns and try to represent those motions through position-time, velocity-time, and acceleration-time graphs as a means of better understanding graphing motion.
Mindmap
Keywords
💡Graphing Motion
💡Position-Velocity-Acceleration
💡Particle Diagram
💡Slope
💡Constant Velocity
💡Acceleration
💡Position-Time Graph
💡Velocity-Time Graph
💡Acceleration-Time Graph
💡Area Under the Graph
💡Uniformly Accelerated Motion
Highlights
Introduction to graphing motion, focusing on constructing and interpreting graphs for position, velocity, and acceleration.
Explanation of particle diagrams, also known as dot diagrams or ticker-tape diagrams, and their use in analyzing motion.
Illustration of how constant velocity is represented by equally spaced oil drops in a particle diagram.
Description of how acceleration affects the spacing of oil drops in a particle diagram, indicating changes in velocity over time.
Discussion on the inability to determine direction from oil drop patterns alone, emphasizing the need to observe the object in motion.
Introduction to position-time graphs and their use in understanding an object's position as a function of time.
Example of a dog's motion used to explain the relationship between position, velocity, and time.
Explanation of how the slope of a position-time graph represents an object's velocity.
Illustration of how a horizontal line in a position-time graph indicates zero velocity and hence zero acceleration.
Demonstration of how the area under a velocity-time graph corresponds to the distance traveled by an object.
Clarification that the slope of a velocity-time graph indicates the acceleration of an object.
Explanation of the relationship between acceleration-time graphs and changes in velocity.
Practical application of graphing motion through the activity of walking back and forth in a straight line for 15 seconds.
Suggestion to practice drawing position-time, velocity-time, and acceleration-time graphs based on one's own motion.
Recommendation to collaborate with a friend to recreate motions described by each other's graphs.
Advocacy for visiting eight plus physics.com for more information and to address any questions.
Transcripts
Browse More Related Video

Velocity Time Graphs, Acceleration & Position Time Graphs - Physics
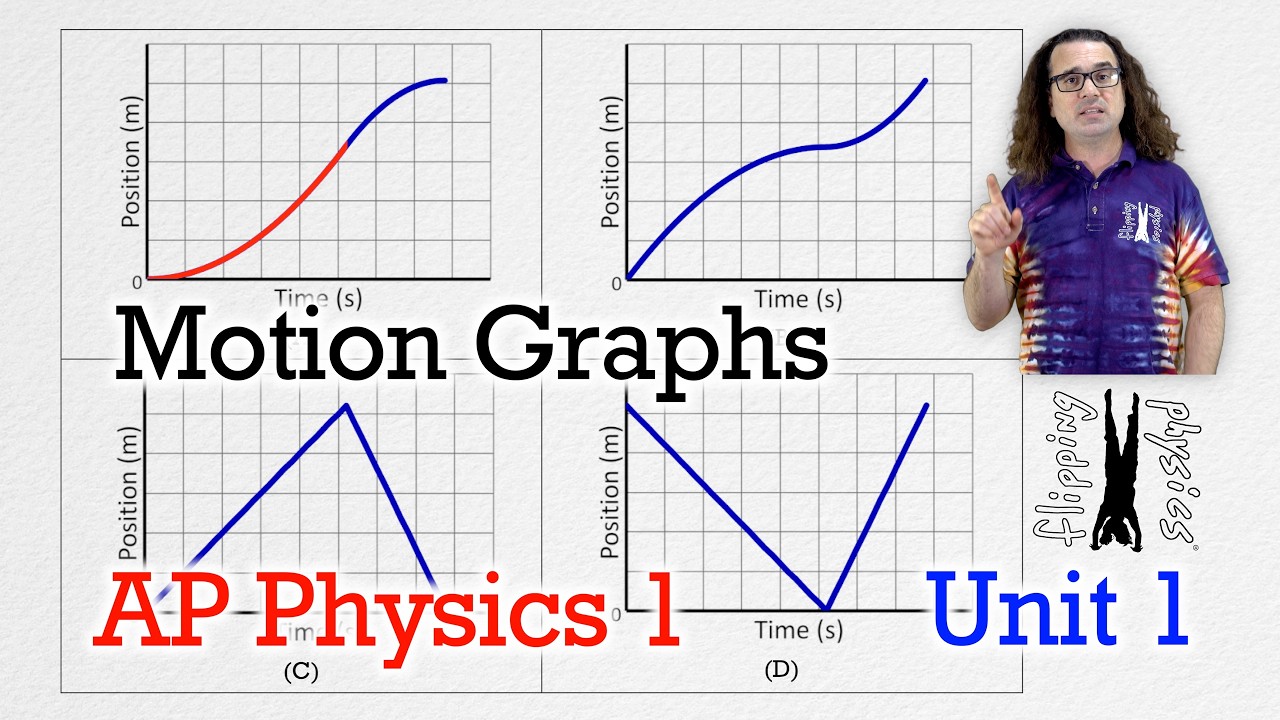
Motion Graphs - AP Physics 1: Kinematics Review Supplement
Distance (position) to Velocity Time Graph Physics Help

GCSE Physics - Velocity Time Graphs #54
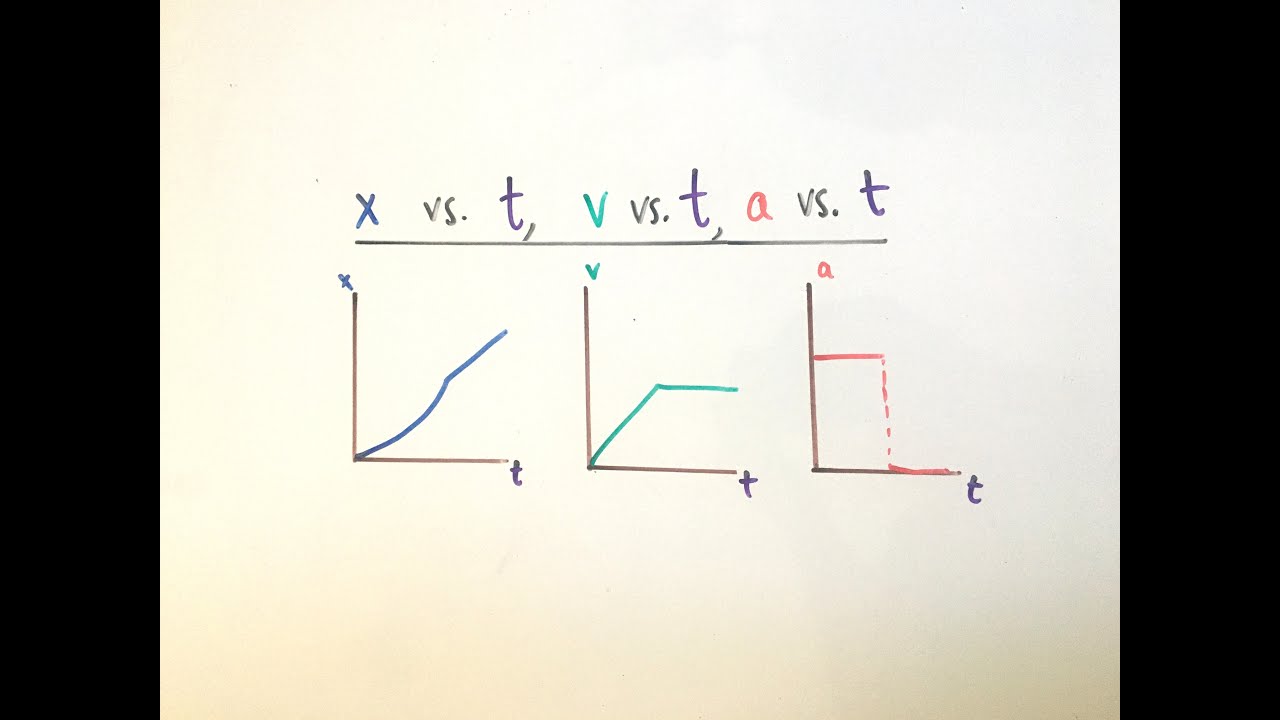
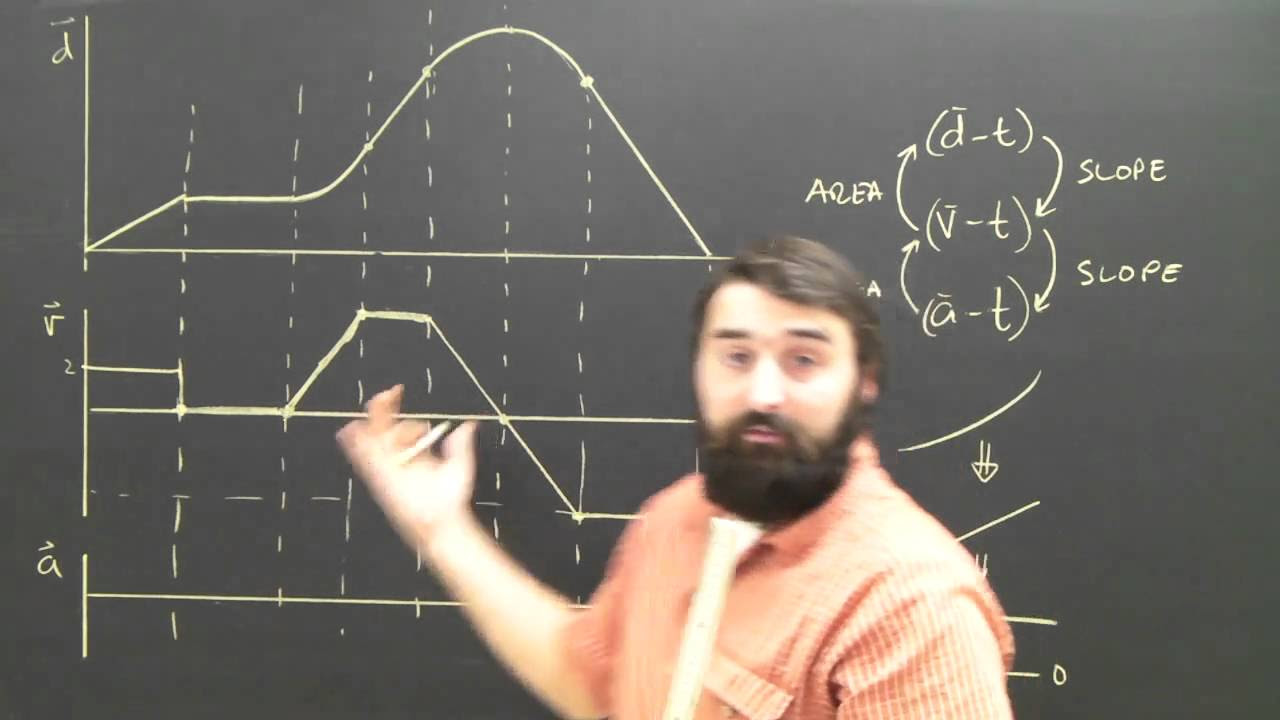
Position/Velocity/Acceleration vs. Time Graphs (AP Physics 1)
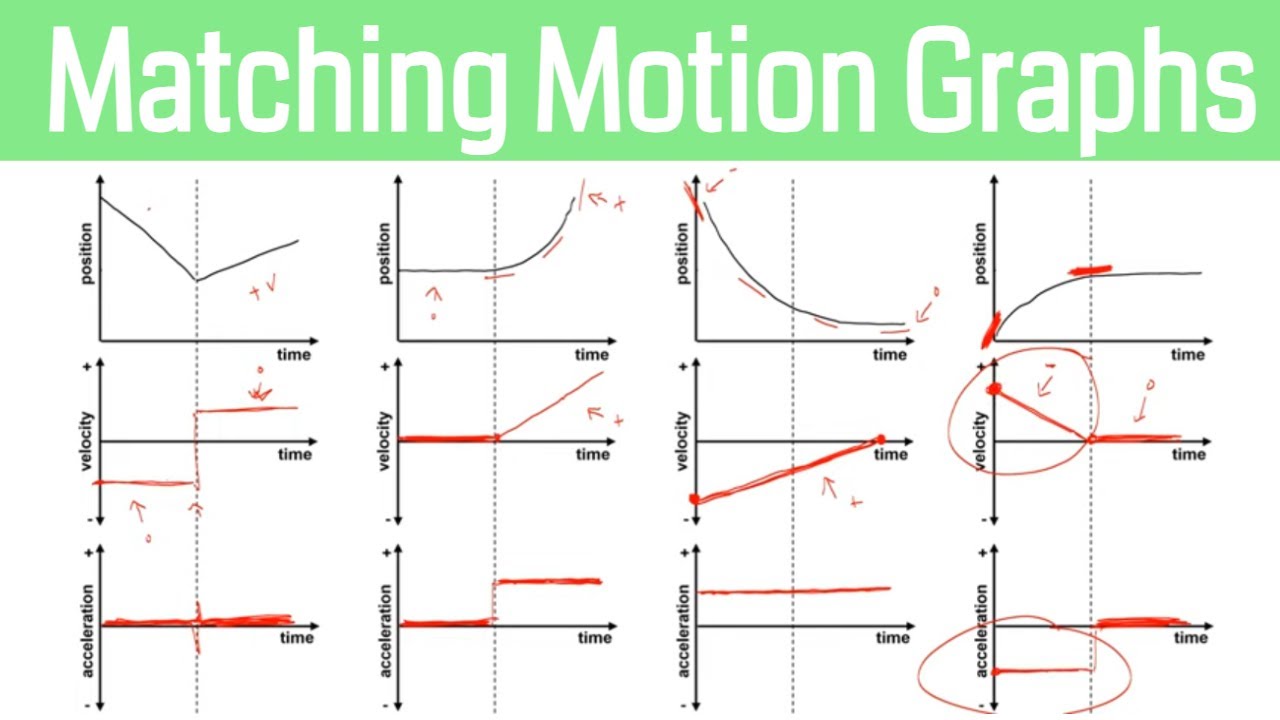
How to Match Motion Graphs in Physics
5.0 / 5 (0 votes)
Thanks for rating: